Plain Talk On Oil Production
Last Wednesday Plains All American (PAGP) held their Investor Day. These events typically afford investors the opportunity to get more detail on the company, but Plains also has a sophisticated macro view of the oil market. As the biggest crude oil transportation company in America they naturally care a lot about North American output. CEO Greg Armstrong invariably provides many great insights. Below are some selected slides from their presentation.
Plains’ research focuses more on forecasting volumes rather than prices; as befits an energy infrastructure operator, the volumes of crude oil moved are more important than the value, although there’s clearly a linkage because high prices stimulate output.
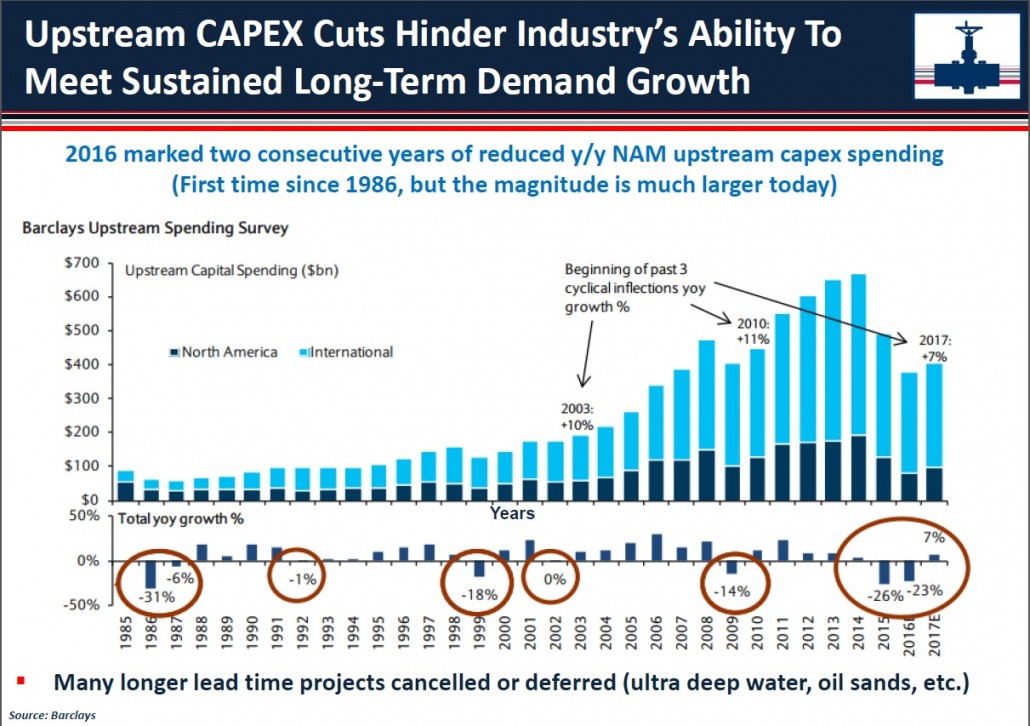
The first slide notes the sharp drop in upstream capex budgets which will eventually manifest itself through constrained supply. The 2015-16 drop in budgets is the biggest in thirty years. There is little excess output capacity, and notwithstanding recent weakness in oil prices, over time the market will be increasingly vulnerable to a spike.
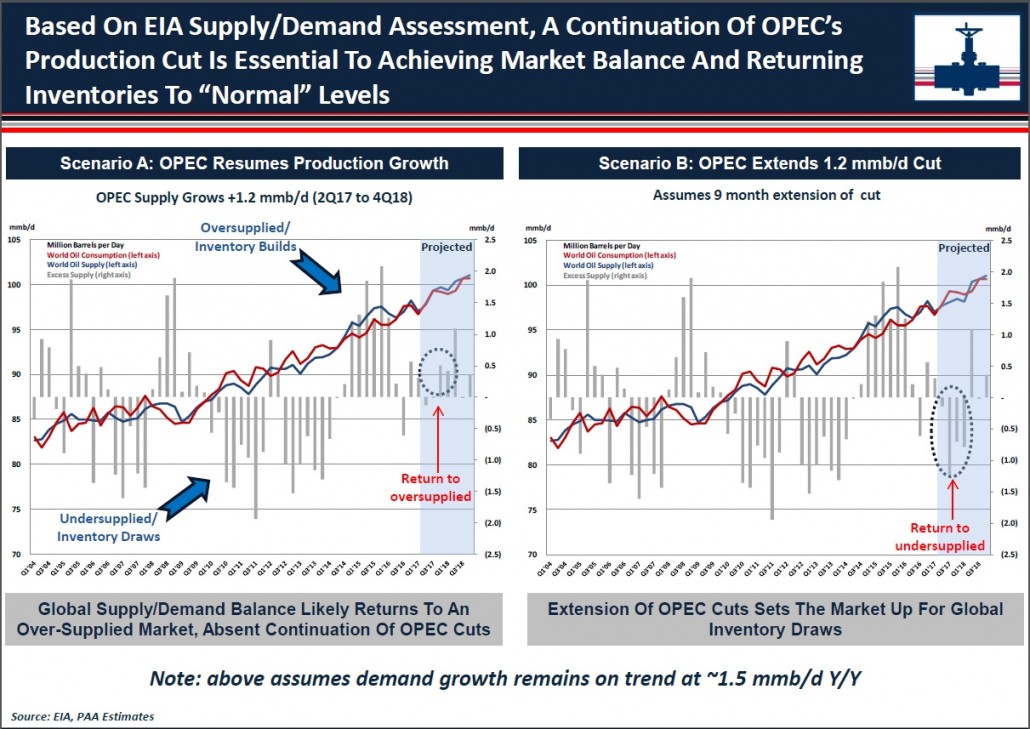
The second slide notes the impact of OPEC’s production cuts. Plains held their Investor Day a day before the OPEC meeting which extended the cuts through 1Q18. Note that the right hand chart assumes the 1.2 Million Barrel/Day (MMB/D) OPEC cut is extended, which should approximately absorb global inventories in excess of historic averages. Russia and other non-OPEC producers are expected to make up the balance of the 1.8MMB/D contained in their announcement. In short, Plains believes the market will balance as a result.
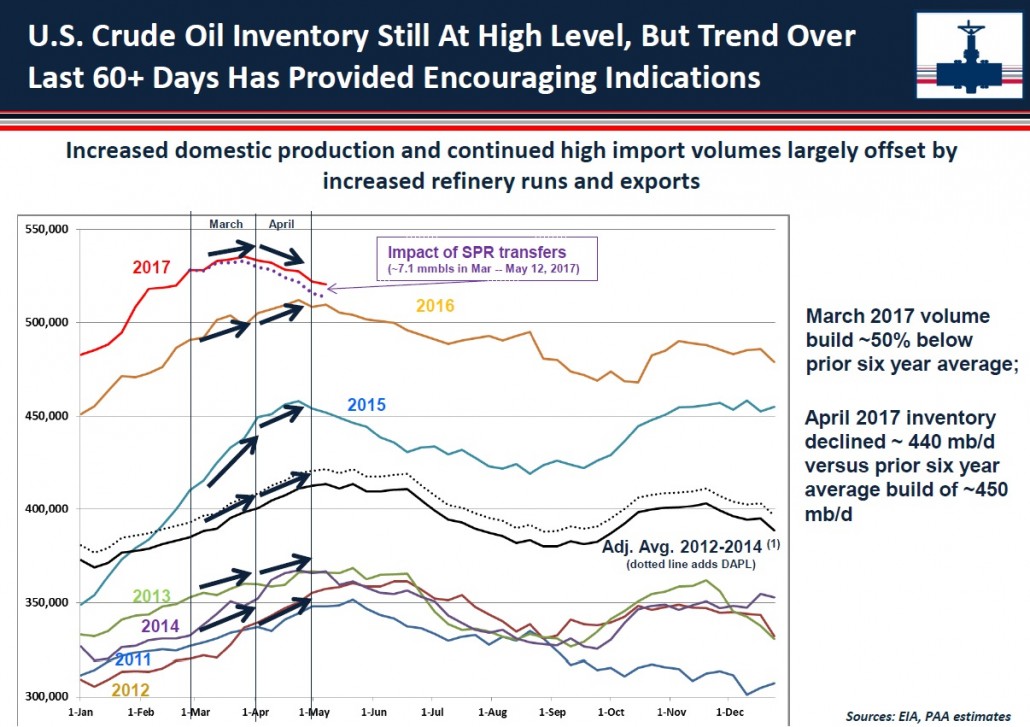
This slide on U.S. inventories notes their currently high level compared with prior years but also that recent builds have been substantially lower than in the past.
During the Q&A session, CEO Armstrong referred to shale drilling as a manufacturing process, a common analogy nowadays because the short cycle nature of shale projects (see Oil Futures Say Shale’s Here to Stay) results in fast return of capital with commensurately less risk. Much of this higher capital velocity is driven by improving efficiencies (see Extracting Supply Forecasts from Oil Futures).
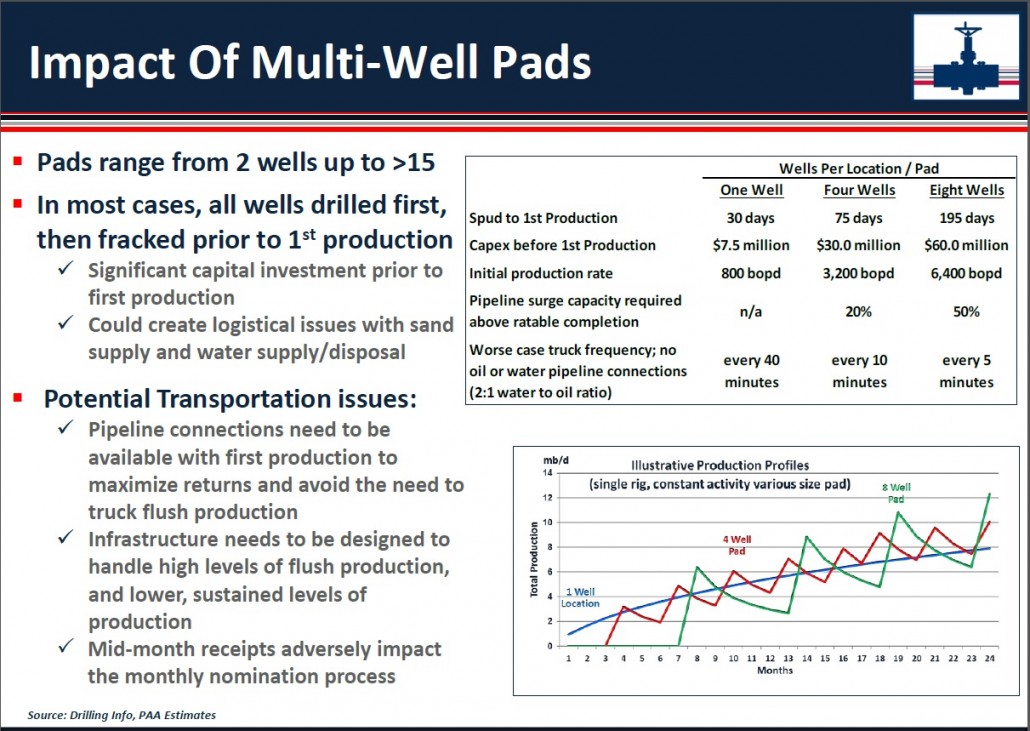
One example of efficiencies is the use of multi-well pads. This can sharply increase the production from each rig in use, but comes with logistical challenges. Typically, all the wells are drilled first, then fracked. This lengthens the time from initiation until production and increases the upfront capital investment; it also results in more variable output as the bottom right illustration in the above slide shows, with volumes coming in spurts. The uneven output creates additional challenges for the Exploration and Production (E&P) company as well as the supporting infrastructure.
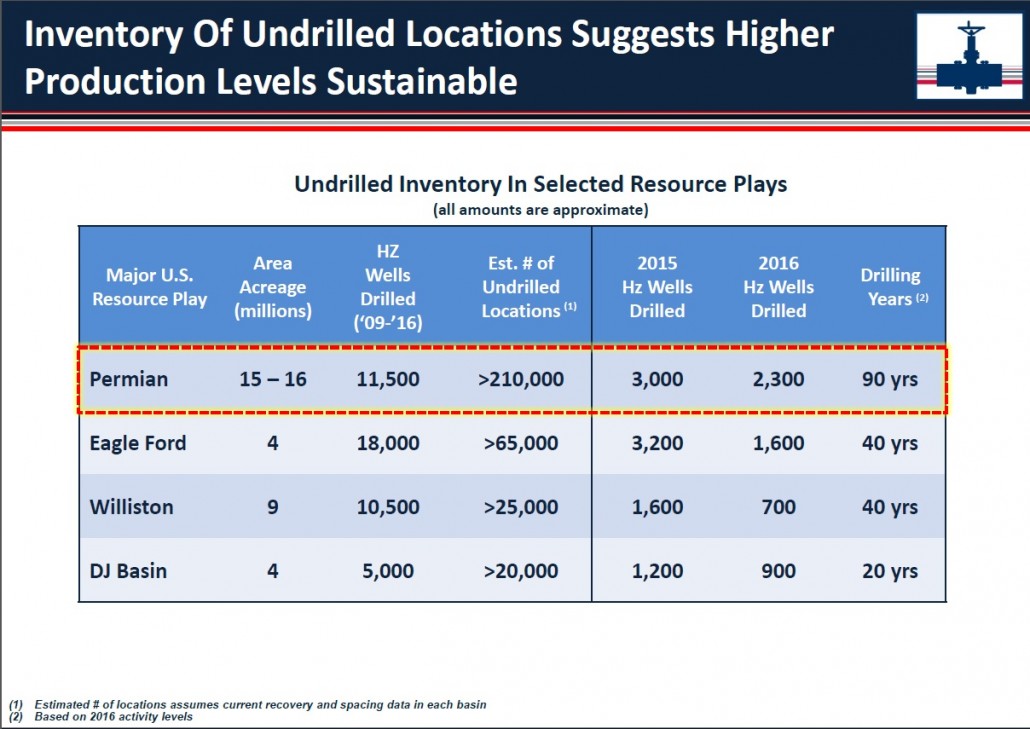
Today there is far greater certainty about the returns from a given level of investment than has traditionally been the case for the energy industry. In fact, Armstrong noted that forecasting production relies heavily on knowing how much capital E&P companies will commit (which is itself dependent on expected returns). The reasonably high visibility around output given capex informs the table below, showing several decades of resource availability. In a memorable quote, Greg Armstromg said, “The world may not need another million barrels a day of Permian crude, but it’s coming.”
Lastly, investors often ask whether there is excess infrastructure. The answer is never simply yes or no. New pipelines are typically built in anticipation of growing supply. Production ramps up steadily, whereas a pipeline offers capacity only when it’s completed.
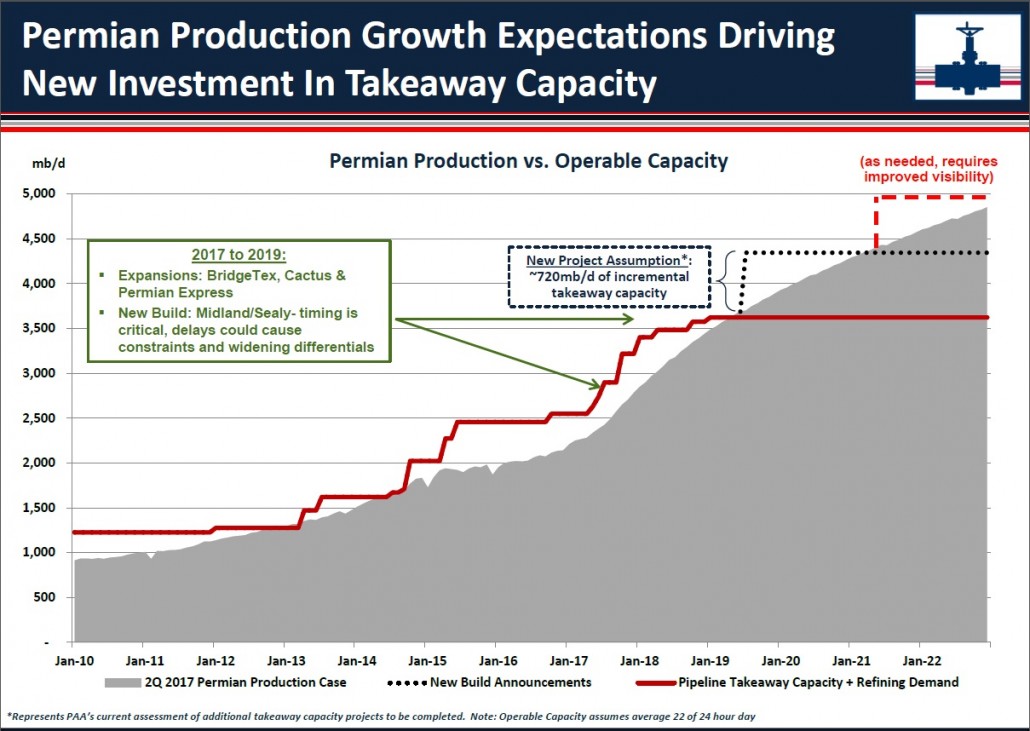
The result is, when you plot pipeline capacity and supply of product, you get a chart like this one. The market seeks a narrow gap between the red line (pipeline takeaway capacity plus refinery demand) and the grey area (production). But capacity comes online in a step function, while production moves more gradually. Too much capacity can hurt pipeline margins, but insufficient capacity can leave E&P companies scrambling for alternative transportation (rail or truck, both much more expensive). The challenge for companies like Plains is to build charts like this correctly and then plan their infrastructure investments accordingly. It’s why they focus so carefully on the fundamentals driving their E&P customers.
On a lighter note, I can report that hydraulic fracturing (“fracking”), the process by which water is injected at high pressure into the porous rock holding hydrocarbons, thereby creating millions of cracks and releasing it, has found its way into popular culture. Brockmire, a show available on Amazon Prime, centers on a baseball announcer covering a minor league team in Pennsylvania (think Marcellus Shale) called the Frackers. A local E&P company sets its sights on the (poorly attended) Frackers stadium for waste water disposal. I won’t spoil the plot any further, but discussion of fracking and shale are no longer limited to members of the energy sector. Our thanks to MLP investor Michael Hickey of Forest Park, IL for drawing this to our attention.
We are invested in PAGP

Important Disclosures
The information provided is for informational purposes only and investors should determine for themselves whether a particular service, security or product is suitable for their investment needs. The information contained herein is not complete, may not be current, is subject to change, and is subject to, and qualified in its entirety by, the more complete disclosures, risk factors and other terms that are contained in the disclosure, prospectus, and offering. Certain information herein has been obtained from third party sources and, although believed to be reliable, has not been independently verified and its accuracy or completeness cannot be guaranteed. No representation is made with respect to the accuracy, completeness or timeliness of this information. Nothing provided on this site constitutes tax advice. Individuals should seek the advice of their own tax advisor for specific information regarding tax consequences of investments. Investments in securities entail risk and are not suitable for all investors. This site is not a recommendation nor an offer to sell (or solicitation of an offer to buy) securities in the United States or in any other jurisdiction.
References to indexes and benchmarks are hypothetical illustrations of aggregate returns and do not reflect the performance of any actual investment. Investors cannot invest in an index and do not reflect the deduction of the advisor’s fees or other trading expenses. There can be no assurance that current investments will be profitable. Actual realized returns will depend on, among other factors, the value of assets and market conditions at the time of disposition, any related transaction costs, and the timing of the purchase. Indexes and benchmarks may not directly correlate or only partially relate to portfolios managed by SL Advisors as they have different underlying investments and may use different strategies or have different objectives than portfolios managed by SL Advisors (e.g. The Alerian index is a group MLP securities in the oil and gas industries. Portfolios may not include the same investments that are included in the Alerian Index. The S & P Index does not directly relate to investment strategies managed by SL Advisers.)
This site may contain forward-looking statements relating to the objectives, opportunities, and the future performance of the U.S. market generally. Forward-looking statements may be identified by the use of such words as; “believe,” “expect,” “anticipate,” “should,” “planned,” “estimated,” “potential” and other similar terms. Examples of forward-looking statements include, but are not limited to, estimates with respect to financial condition, results of operations, and success or lack of success of any particular investment strategy. All are subject to various factors, including, but not limited to general and local economic conditions, changing levels of competition within certain industries and markets, changes in interest rates, changes in legislation or regulation, and other economic, competitive, governmental, regulatory and technological factors affecting a portfolio’s operations that could cause actual results to differ materially from projected results. Such statements are forward-looking in nature and involves a number of known and unknown risks, uncertainties and other factors, and accordingly, actual results may differ materially from those reflected or contemplated in such forward-looking statements. Prospective investors are cautioned not to place undue reliance on any forward-looking statements or examples. None of SL Advisors LLC or any of its affiliates or principals nor any other individual or entity assumes any obligation to update any forward-looking statements as a result of new information, subsequent events or any other circumstances. All statements made herein speak only as of the date that they were made. r
Certain hyperlinks or referenced websites on the Site, if any, are for your convenience and forward you to third parties’ websites, which generally are recognized by their top level domain name. Any descriptions of, references to, or links to other products, publications or services does not constitute an endorsement, authorization, sponsorship by or affiliation with SL Advisors LLC with respect to any linked site or its sponsor, unless expressly stated by SL Advisors LLC. Any such information, products or sites have not necessarily been reviewed by SL Advisors LLC and are provided or maintained by third parties over whom SL Advisors LLC exercise no control. SL Advisors LLC expressly disclaim any responsibility for the content, the accuracy of the information, and/or quality of products or services provided by or advertised on these third-party sites.
All investment strategies have the potential for profit or loss. Different types of investments involve varying degrees of risk, and there can be no assurance that any specific investment will be suitable or profitable for a client’s investment portfolio.
Past performance of the American Energy Independence Index is not indicative of future returns.
Leave a Reply
Want to join the discussion?Feel free to contribute!