What Matters More, Price or Volumes?
If you talk to investors about U.S. energy infrastructure, you’re pretty soon going to get to crude oil. A view on one is seemingly predicated on the other. Some investors mutter darkly about assertions in years back that Master Limited Partnerships (MLPs) are a toll-like business model with limited sensitivity to commodities. Although it remains largely accurate, such talk is rarely heard nowadays because it’s so at odds with recent market history. Fee-based cashflows and a pipeline network that is 93% non-crude oil (natural gas is a more frequent pipeline user) don’t sway people. So here are some charts and numbers to help.
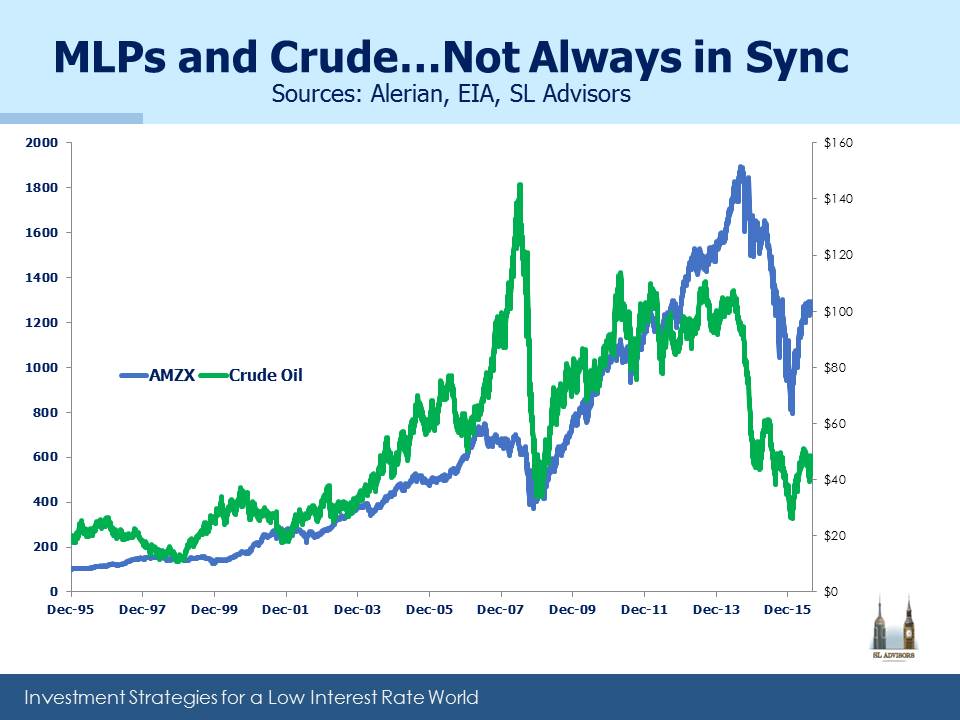
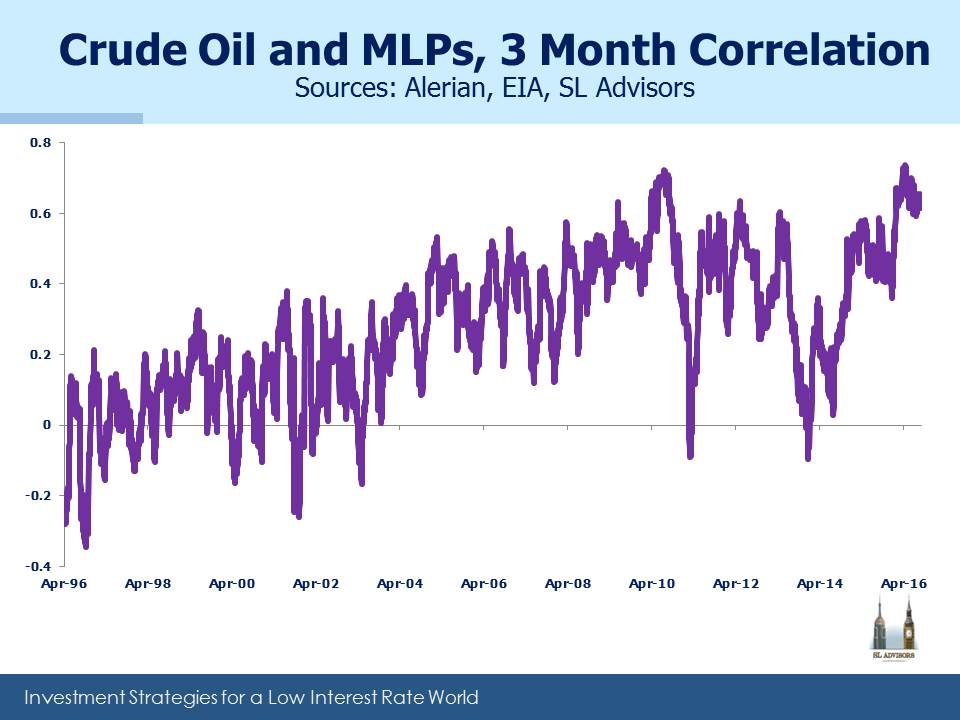
Visually, MLPs and crude have had strong and weak relationships. We’re currently in a period of high correlation, because part of the MLP story relates to volume growth versus infrastructure capacity. Natural gas prices and MLPs have no statistical connection.
As we noted in MLP Investors Digest Supply, getting granular involves forecasting hydrocarbon output versus take-away capacity. The chart below on the Permian Basin illustrates.
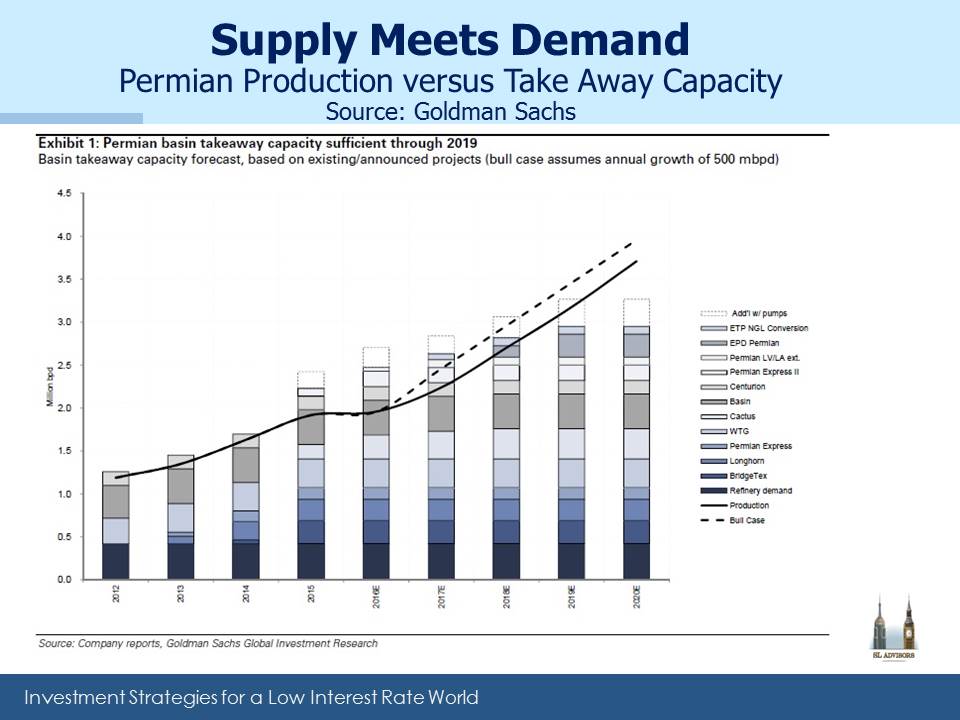
Crude oil production and the means to transport it away are both expected to grow. Exploration and Production (E&P) companies co-ordinate closely with infrastructure providers to match oil supply with take-away capacity. An E&P company with no ability to get its output in a pipeline network is no happier than the owner of an empty pipe. Future Gathering and Processing take-away capacity has more visibility than does future output, but both sides are trying to match expectations. And of course there are many players of all sizes, which makes it a complex dance. If you own infrastructure in the region you want output to grow faster than expected, increasing demand for your scarce resource. Higher oil prices make this more likely. Hence, some sensitivity between crude oil and MLPs makes sense, although not to the degree seen recently.
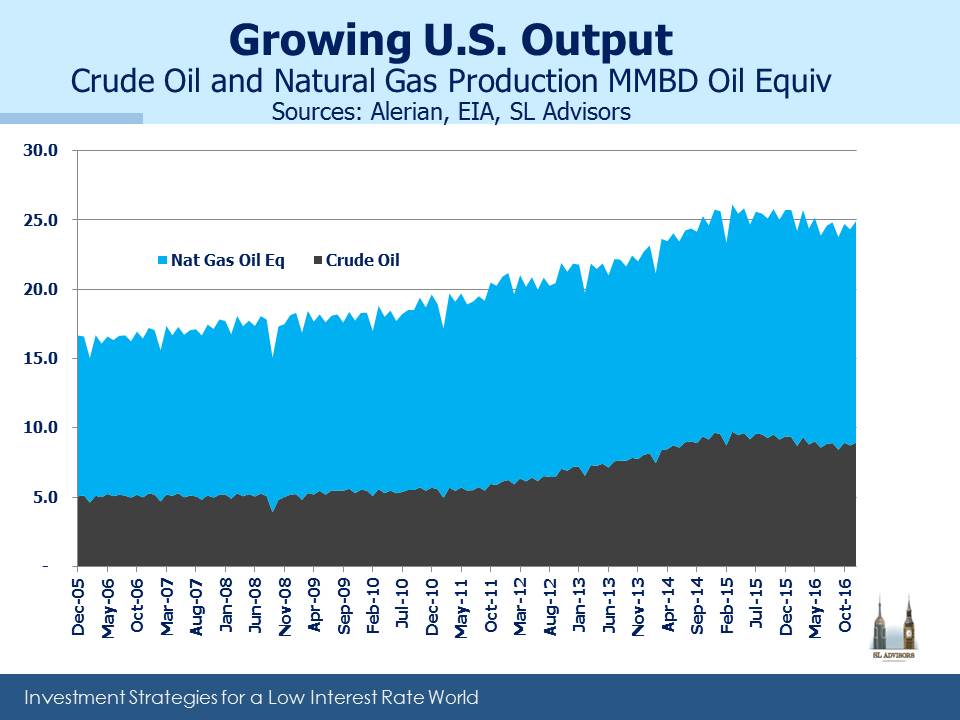
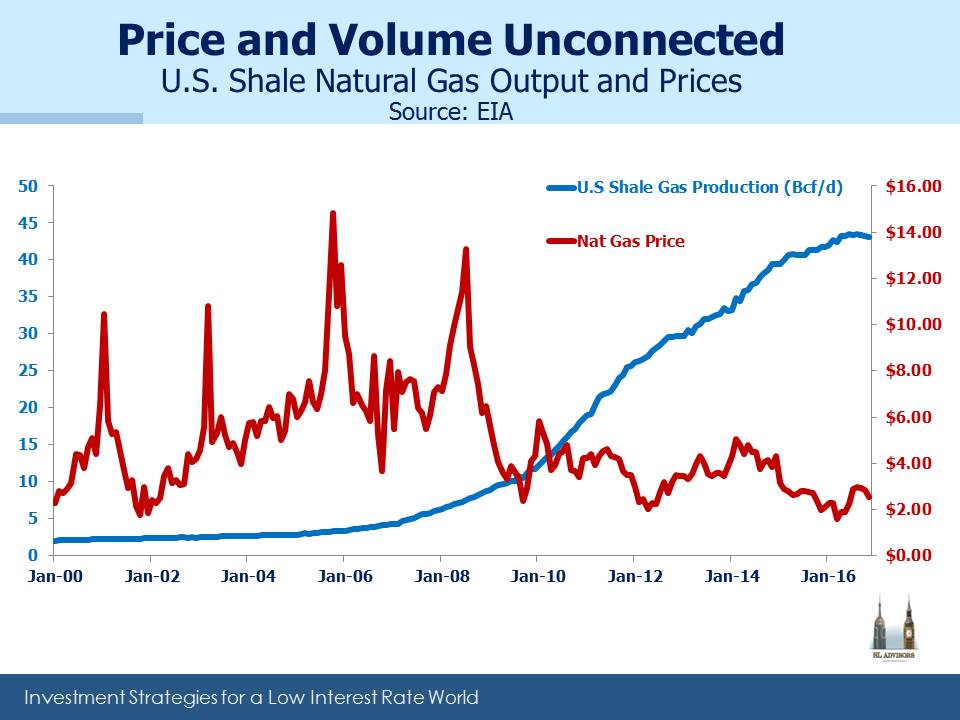
Over the last decade, U.S. crude oil and natural gas output have steadily increased, with a modest pullback in 2015-16. The above chart also shows that on an energy equivalent basis we produce almost twice as much natural gas as crude oil, which is why we often note that U.S. energy infrastructure is more of a natural gas story. As the chart below shows, natural gas production has expanded rapidly, seemingly oblivious to steadily declining prices. Dramatic improvements in efficiency are the reason, and the same thing is happening with shale production of oil.
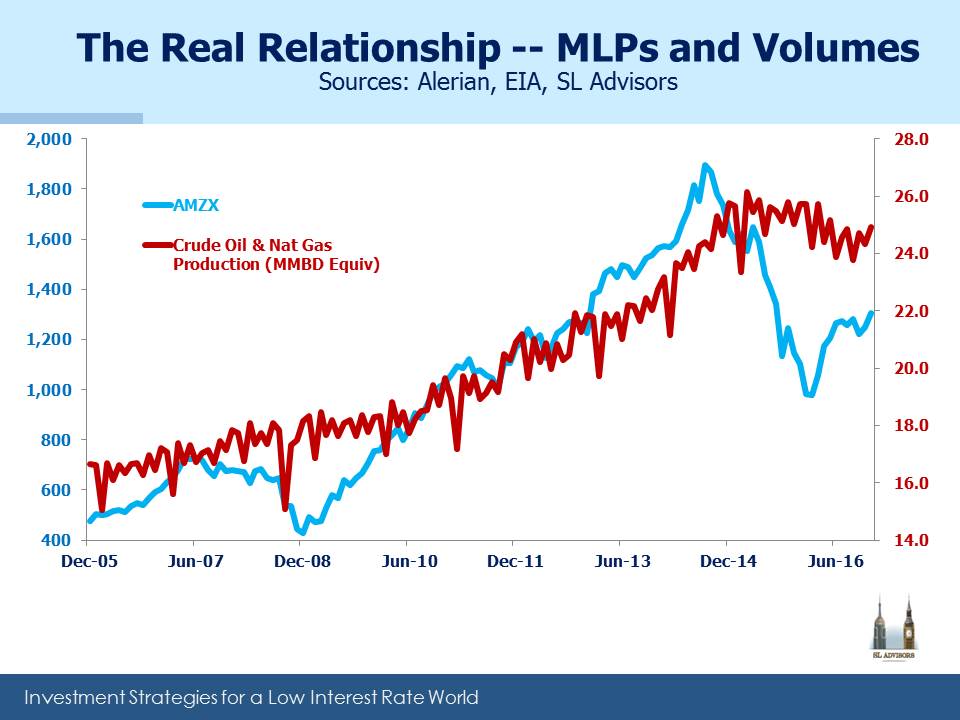
Higher volumes have driven the need for more infrastructure and growth for MLPs. This is the more important relationship, and as the chart below shows, volumes have tracked MLPs better than prices. So a positive view on MLPs today rests on a forecast of continued growth in output. On Friday the weekly Baker Hughes U.S. rig count leapt by 21 to 789, up from 476 a year ago. The continued increase following the drop in crude prices shows that the domestic energy industry is less worried about falling oil than MLP investors seem to be.
Forecasting prices is difficult, but steadily higher volumes over time look like a much safer bet. As we noted last week in Shale Upends Conventional Thinking, demand for short-cycle projects is causing a shift in capex to the U.S. because that’s where a lot of those projects are. Long-cycle projects whose capital recycling extends out beyond the liquidity of the futures market (two-three years) are a bet on prices. That’s far more risky nowadays following last year’s collapse in crude pricing. The Energy Information Administration’s recent Annual Energy Outlook 2017 forecasts steadily rising crude oil production and continued near 4% annual growth in natural gas output. Crude prices matter in the short term, but over the long term volumes will drive returns.

Important Disclosures
The information provided is for informational purposes only and investors should determine for themselves whether a particular service, security or product is suitable for their investment needs. The information contained herein is not complete, may not be current, is subject to change, and is subject to, and qualified in its entirety by, the more complete disclosures, risk factors and other terms that are contained in the disclosure, prospectus, and offering. Certain information herein has been obtained from third party sources and, although believed to be reliable, has not been independently verified and its accuracy or completeness cannot be guaranteed. No representation is made with respect to the accuracy, completeness or timeliness of this information. Nothing provided on this site constitutes tax advice. Individuals should seek the advice of their own tax advisor for specific information regarding tax consequences of investments. Investments in securities entail risk and are not suitable for all investors. This site is not a recommendation nor an offer to sell (or solicitation of an offer to buy) securities in the United States or in any other jurisdiction.
References to indexes and benchmarks are hypothetical illustrations of aggregate returns and do not reflect the performance of any actual investment. Investors cannot invest in an index and do not reflect the deduction of the advisor’s fees or other trading expenses. There can be no assurance that current investments will be profitable. Actual realized returns will depend on, among other factors, the value of assets and market conditions at the time of disposition, any related transaction costs, and the timing of the purchase. Indexes and benchmarks may not directly correlate or only partially relate to portfolios managed by SL Advisors as they have different underlying investments and may use different strategies or have different objectives than portfolios managed by SL Advisors (e.g. The Alerian index is a group MLP securities in the oil and gas industries. Portfolios may not include the same investments that are included in the Alerian Index. The S & P Index does not directly relate to investment strategies managed by SL Advisers.)
This site may contain forward-looking statements relating to the objectives, opportunities, and the future performance of the U.S. market generally. Forward-looking statements may be identified by the use of such words as; “believe,” “expect,” “anticipate,” “should,” “planned,” “estimated,” “potential” and other similar terms. Examples of forward-looking statements include, but are not limited to, estimates with respect to financial condition, results of operations, and success or lack of success of any particular investment strategy. All are subject to various factors, including, but not limited to general and local economic conditions, changing levels of competition within certain industries and markets, changes in interest rates, changes in legislation or regulation, and other economic, competitive, governmental, regulatory and technological factors affecting a portfolio’s operations that could cause actual results to differ materially from projected results. Such statements are forward-looking in nature and involves a number of known and unknown risks, uncertainties and other factors, and accordingly, actual results may differ materially from those reflected or contemplated in such forward-looking statements. Prospective investors are cautioned not to place undue reliance on any forward-looking statements or examples. None of SL Advisors LLC or any of its affiliates or principals nor any other individual or entity assumes any obligation to update any forward-looking statements as a result of new information, subsequent events or any other circumstances. All statements made herein speak only as of the date that they were made. r
Certain hyperlinks or referenced websites on the Site, if any, are for your convenience and forward you to third parties’ websites, which generally are recognized by their top level domain name. Any descriptions of, references to, or links to other products, publications or services does not constitute an endorsement, authorization, sponsorship by or affiliation with SL Advisors LLC with respect to any linked site or its sponsor, unless expressly stated by SL Advisors LLC. Any such information, products or sites have not necessarily been reviewed by SL Advisors LLC and are provided or maintained by third parties over whom SL Advisors LLC exercise no control. SL Advisors LLC expressly disclaim any responsibility for the content, the accuracy of the information, and/or quality of products or services provided by or advertised on these third-party sites.
All investment strategies have the potential for profit or loss. Different types of investments involve varying degrees of risk, and there can be no assurance that any specific investment will be suitable or profitable for a client’s investment portfolio.
Past performance of the American Energy Independence Index is not indicative of future returns.
What ratio are you now using to calculate the equivalency of natural gas and crude oil? Is it still 6 to 1 as in days of yore?
Elliot Miller
Conversion factor 5,658.53 Cu Ft Nat Gas = 1 Barrel Crude Oil BTU equiv