It’s Iran’s Move

If one thing’s clear about recent developments in the Middle East, it’s that events defy prediction. Yet timing trades in the energy sector requires the seemingly impossible.

On Monday, we listened to a thoughtful call arranged by RW Baird with Greg Priddy, Director, Global Energy and Middle East, at Stratfor. Greg expects a measured, near term response from Iran intended to be regarded as proportional, allowing for a similar U.S. response (i.e. target a couple of Iranian missile installations), and thereby avoiding escalation. It sounds very neat, and prone to miscalculation.

Greg Priddy felt that the virtual collapse of the Iranian nuclear deal is more problematic over the long run. In its first response to the killing of General Suleimani, the government announced that, “Iran will continue its nuclear enrichment with no limitations and based on its technical needs.” As Iran approaches an offensive nuclear capability, this is likely to draw a response from Israel or the U.S. He put the timeframe as by the summer, which struck us as startlingly soon. Priddy placed the odds of a significant U.S. military attack on Iran this year at 45%.

Ratcheting up the price of crude oil may be one of the few levers Iran holds over President Trump in an election year. So far, oil traders have been surprisingly sanguine about the prospects of supply disruption. Following September’s attack on Saudi infrastructure, oil retraced its initial jump within a couple of weeks, as supply was quickly restored. Some analysts believe that the recent jump in prices won’t be sustained without an actual loss of supply. The Shale Revolution has enhanced America’s freedom to act.

However, given the domestic American politics of rising gas prices, a series of moves to interrupt supply would seem to be one of few meaningful strategies left to Iran. Attacks on fixed targets will draw a U.S. response, but if shipping insurance rates rise and the smooth transport of oil around the world becomes less certain, Iran may yet find it has some leverage and buy it time until the US election.

The problem Iran’s leadership now faces is that it has raised expectations domestically for a robust response, but its choices remain limited. Meanwhile, Trump has shown he’s not interested in nation building or committing U.S. land forces. He  has established a clear red line that the loss of American lives won’t be tolerated. Cruise missiles and drones allow the U.S. to pursue remote yet devastating engagement with minimal risk. Crippling economic sanctions continue to hurt the Iranian population.

Iran’s current approach of low-level, asymmetric attacks has also failed to achieve their goals They may have overplayed their hand, and are now left with few options.  A direct military response risks heavy-handed retaliation, while small provocations through proxies expose Iran’s leaders personally. It’s unclear how Iran’s government can lower tensions, and little evidence they want to.

Trump’s killing of Suleimani highlights how unpredictable the conflict has become. Energy investments are a good insurance policy. The past decade’s underperformance against the S&P500 has left many investors underweight, and lowered the sector’s correlation with the rest of the market. Oil prices don’t yet price much risk premium. Midstream energy infrastructure’s growing free cash flow (see The Coming Pipeline Cash Gusher) is well beyond Iran’s reach, and offers a highly likely outcome in a period of uncertainty.


Stocks Have Been Cheaper

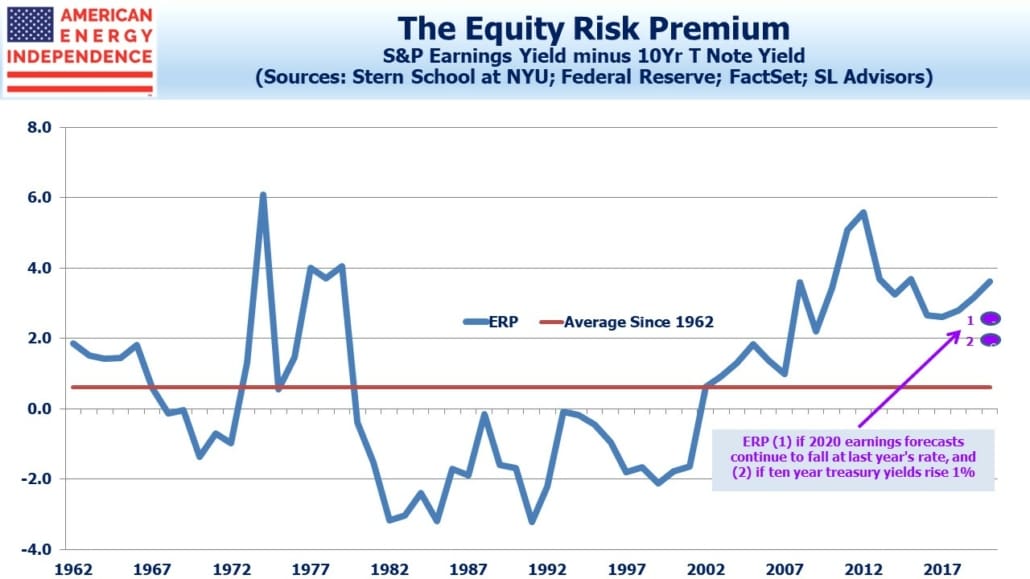
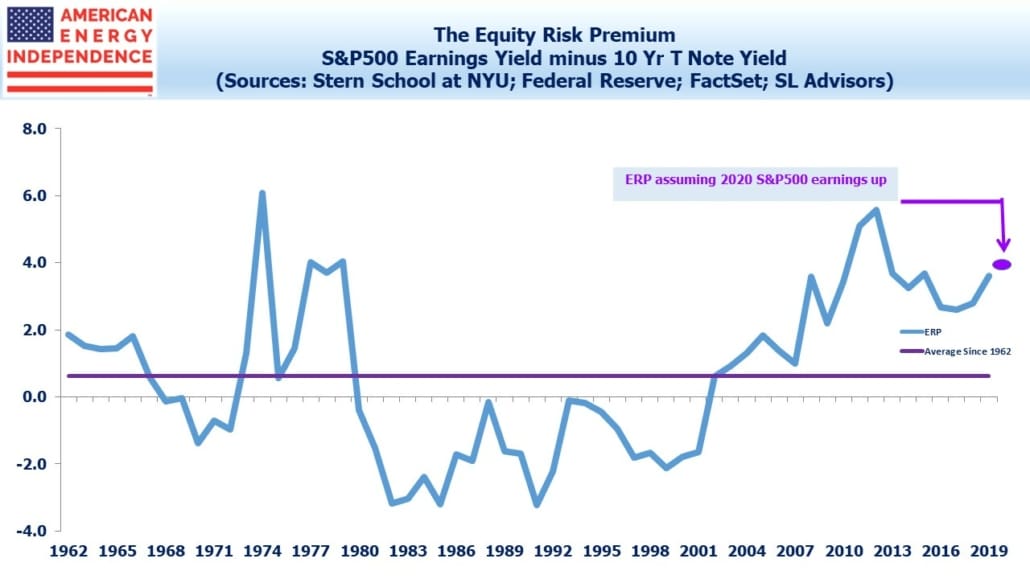
We’ve been using the Equity Risk Premium (ERP) as a measure of the relative attractiveness of stocks for many years. The ERP is the earnings yield (i.e. the reciprocal of the P/E ratio) minus the ten year treasury yield. It compares stocks with bonds, allowing today’s relationship to be compared with history. The S&P500’s P/E is currently 18.1, based on Factset‘s 2020 earnings forecast of $178. That’s an earnings yield of 5.5%, producing an ERP of 3.6 when compared with the ten year treasury yield of 1.9%. Since 1960, the ERP has averaged 0.6, so it currently favors stocks.

The Cyclically Adjusted Price/Earnings Ratio (CAPE), another valuation tool, has been disastrous. It’s shown stocks to be expensive, because it compares the current P/E with the long term average. The flaw in this simple approach is that it ignores interest rates. Stocks are historically expensive, but bonds are even more so. CAPE practitioners have missed out on an enormous rally.

We first wrote about the ERP in 2012 (see The Price of Fear) when it was 6.3. It’s been providing a bullish signal for stocks ever since, as we’ve often pointed out. A year ago it was 4.4. During 2019 yields fell, earnings grew and multiples expanded, all of which supported the market’s 31% return.

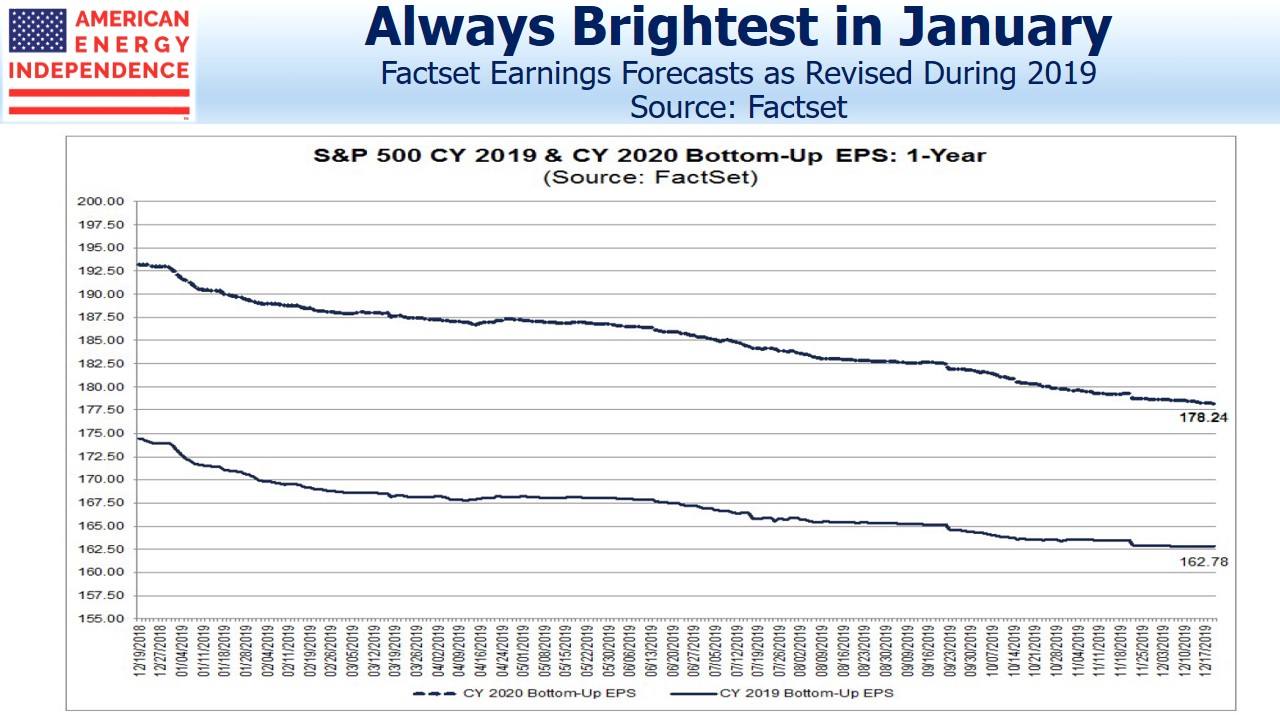
I was chatting with a friend the other day about valuations, and the ERP. Factset bottom up earnings for 2019 began last year at $174 and edged down all year to $163. That’s often the case – sell-side analysts and management guidance typically open the year with optimism that subsequent events gradually erode.

At the end of 2018, the 2020 earnings forecast was $193. It’s already fallen almost 8% to reach its current level of $178. Although at 3.6 the ERP remains wide compared with fifty years of history, it’s less so over the past decade. If the same downward path to earnings forecasts continues, 2020 will come in close to 2019 at around $164. That would push the ERP down to 3.2. A 1% jump in long term rates, always a possibility and more likely than a 1% drop, would move the ERP to 2.2.

Stocks remain a good investment, although they have been substantially more attractive at different points over the past decade. Bonds continue to be an extremely poor long term bet. But it wouldn’t take much for equity valuations to be mundane. One exception might be energy, especially pipelines and other midstream infrastructure, where low valuations should provide more downside support if the broader market takes a tumble. In Pipeline Bond Investors Are More Bullish Than Equity Buyers, we highlighted how cheap pipeline stocks are compared to bonds. Energy was the worst performing sector of the past decade. One result is that it’s far cheaper than the broader equity market.

Wishing all our clients and readers a happy and prosperous 2020.

Natural Gas Profits Remain Elusive

Coal is by any measure an environmental and climate disaster. The world relies on coal in various forms for 27% of its primary energy, and it’s responsible for  40% of its CO2 emissions from fuels. Although it possesses lower energy density than oil or natural gas, coal is relatively easy to transport and store which explains its widespread use. It powered the industrial revolution before rich countries started switching to cleaner-burning natural gas due to local pollution. Today, China consumes half the world’s coal.

A big idea to combat climate change is for the world to phase out coal, replacing it with natural gas. This is already happening to some degree in the U.S. for power generation. Natural gas provides 37% of U.S. power, up from 34% last year. Coal’s share is 25%, down from 28% last year and heading to 22% in 2020.The recent bankruptcy of Murray Energy is a consequence.

Coal has its proponents, including all the industrial users of coal who have invested in processes that rely on it, as well as the coal producers themselves. But the math is that if the 150 billion BTU-equivalent of primary energy generated from coal was instead produced with natural gas, it would roughly halve the CO2 emissions per unit of energy. This would in turn reduce global emissions by 6.6 Gigatons, around 17% and more than the total emitted by the U.S. Climate extremists focused on solutions would push for even greater exports of cheap U.S. natural gas, perhaps supported by the sale of U.S. gas-fired power plants. It’s not as radical as moving to centrally planned economies running on solar and wind, but has the significant advantage of being feasible with today’s technology. Abundant natural gas offers a huge opportunity.

Moreover, coal causes local pollution wherever it’s burned, including sulfur, mercury, lead and arsenic. It emits high concentrations of very fine particulate matter, which cause respiratory damage. Estimates of annual coal-related deaths in the U.S. range from 7.500 to as high as 52,000. For comparison, the U.S. experiences around 40,000 auto-related deaths annually. In China, which burns six times as much coal as the U.S. and has less restrictive pollution rules, estimates of smog-related deaths are as high as 670,000.

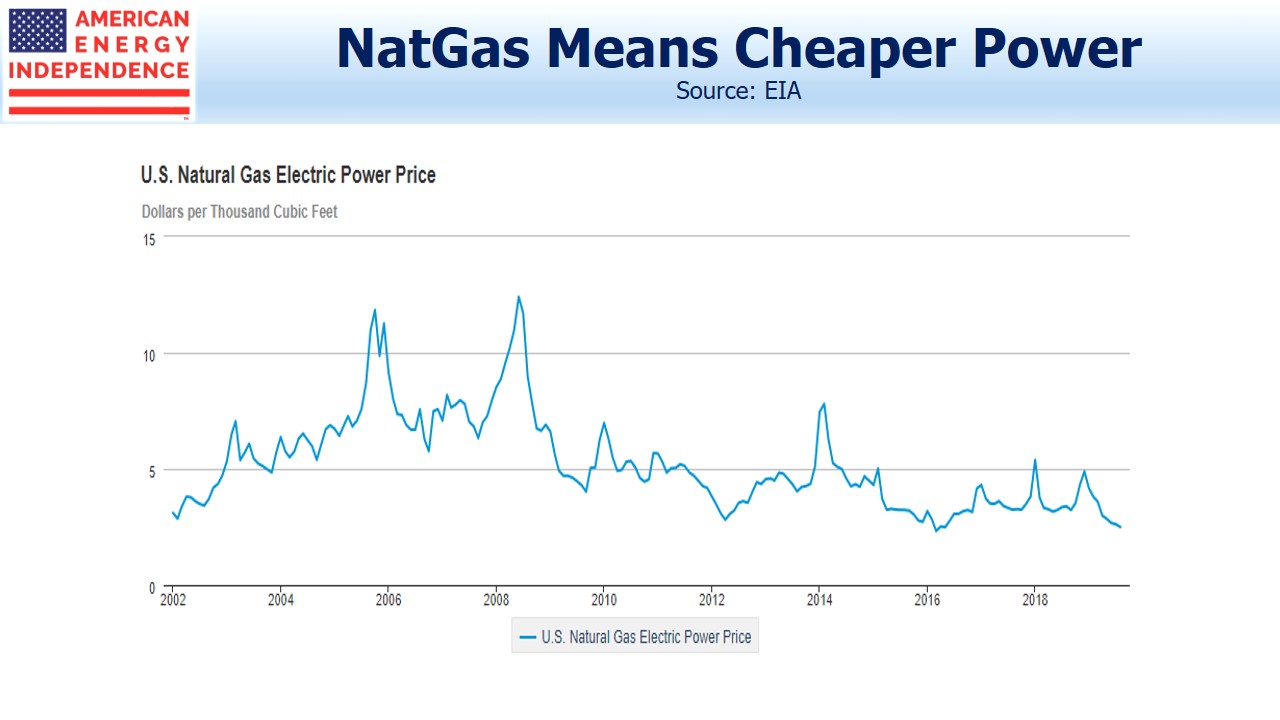
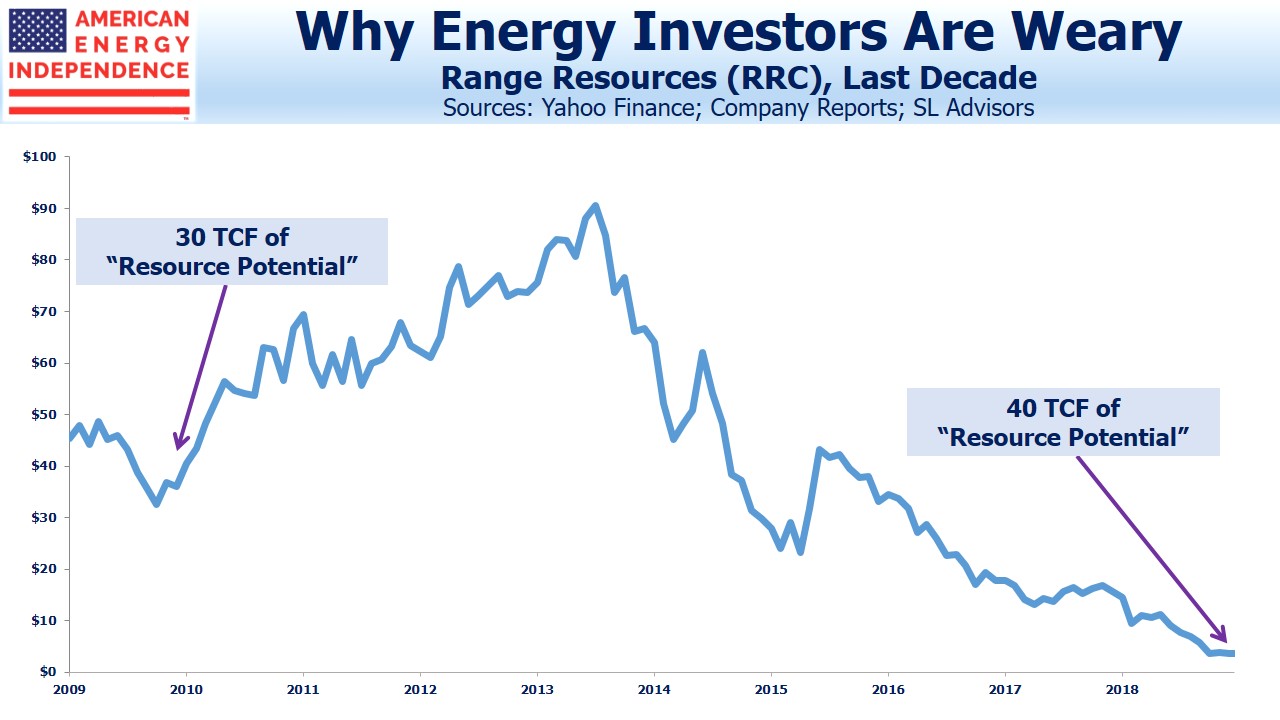
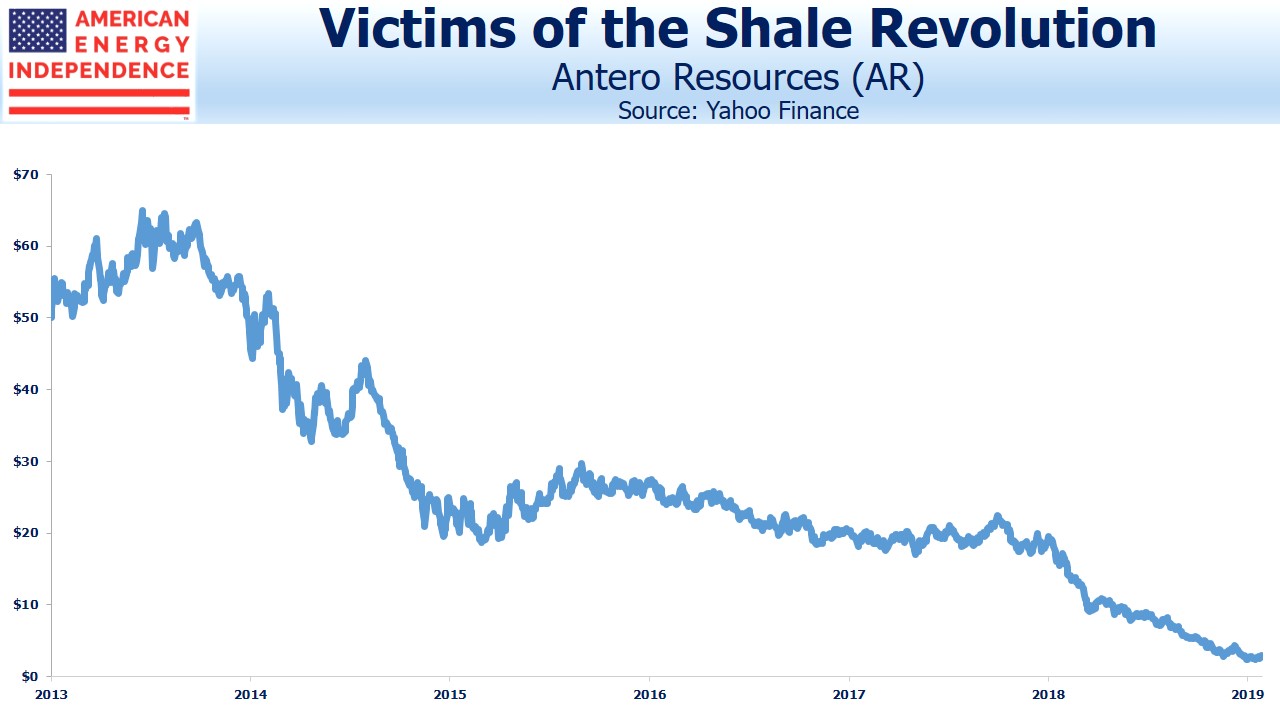
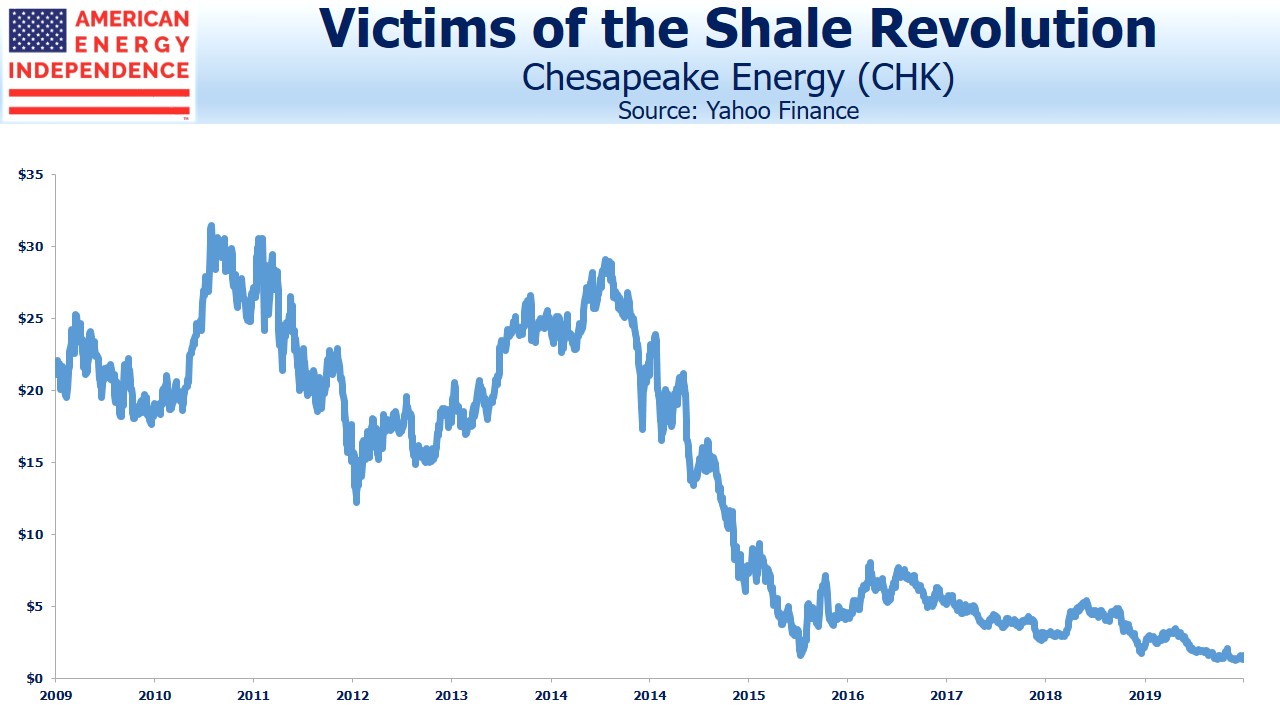
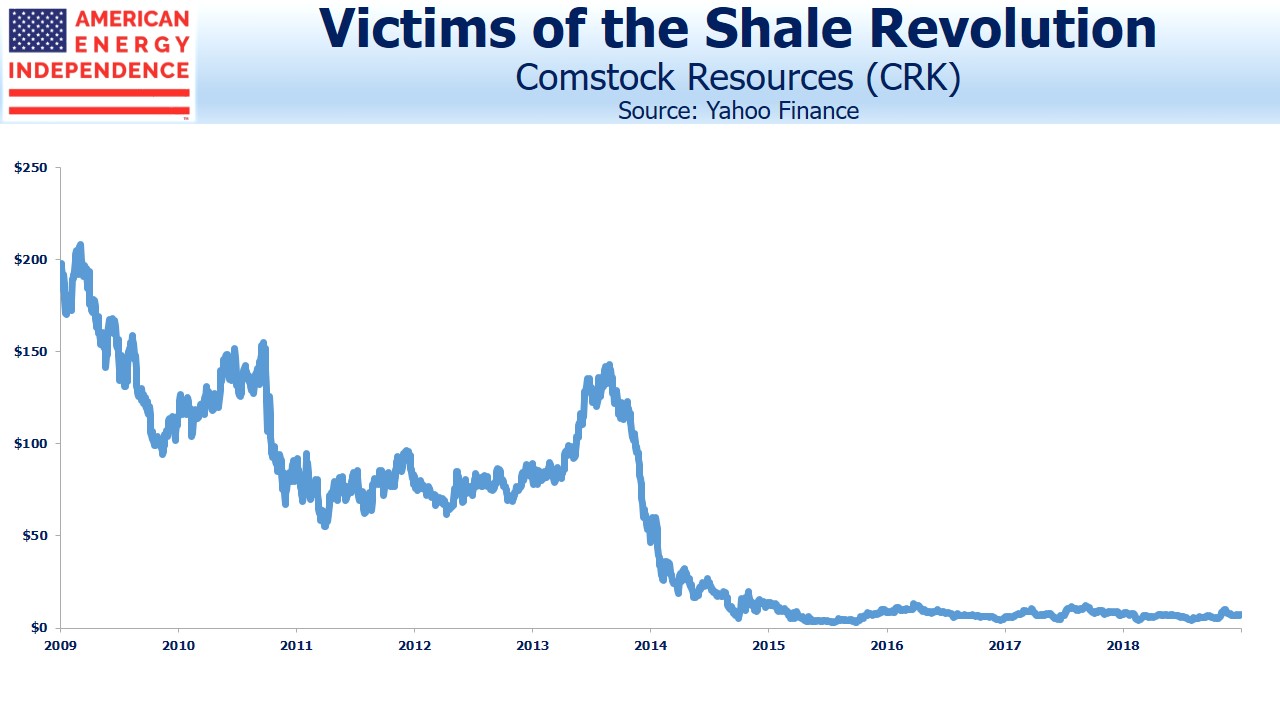
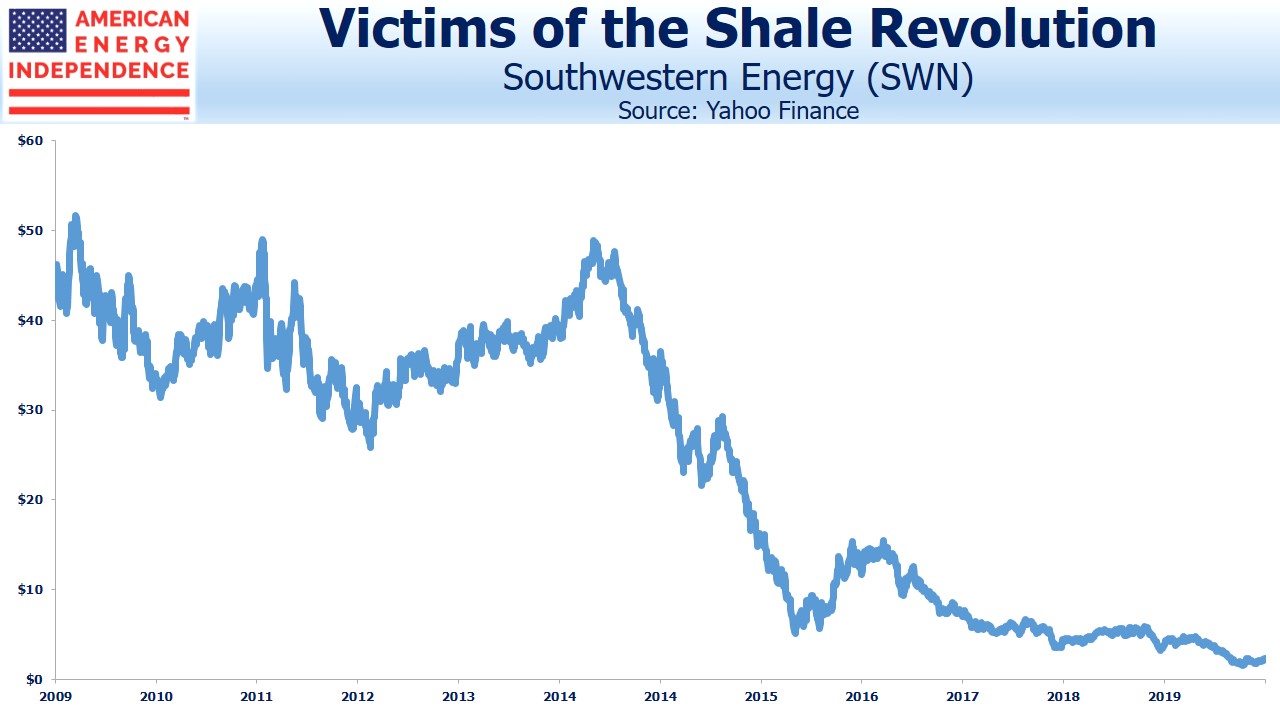
America’s enormous success in producing natural gas has crushed the stock prices of many E&P companies.

Chesapeake (CHK) was the poster child for the Shale Revolution and natural gas under the late Aubrey McClendon. In an SEC filing the company warned that low natural gas prices “raises substantial doubt about our ability to continue as a going concern.”

Range Resources (RRC), Comstock Resources (CRK), Southwest Energy (SWN) and Antero Resources (AR) are among those who have destroyed vast amounts of investor capital in producing abundant natural gas.

Almost a decade ago we were following RRC, SWN and CRK more closely, meeting with management and examining the growth story. Production success has been a poisoned chalice. Increasing output has weighed on prices, recalling the early days of dot.com businesses who sought to cover operating losses by increasing volumes.

Nonetheless, production continues to increase. In the Permian in west Texas, the two most active drillers are Exxon Mobil (XOM) and Chevron (CVX), validating the opportunity of shale as long as it’s exploited by companies with low production costs and strong balance sheets.

Natural gas is increasing its share of the world’s power generation, providing access to cheap energy and lowering emissions. It’s just not clear that the early, smaller E&P companies will survive to benefit.

Elections Usually Boost Earnings

It’s a year until the next presidential election. The S&P500 is making new highs, reflecting the persistence of fund flows into equities. Quarterly earnings have been coming in ahead of expectations, but still down 1% year-on-year. Down less than expected counts as up for traders.

It’s also worth noting that expectations are for a 10% increase in S&P500 earnings next year, according to bottom-up estimates compiled by Factset. A year ago, we noted that equity returns are often strongest in the year following midterms – i.e., preceding presidential election years (see What the Midterms Mean for Stocks). 2019 looks as if it will confirm that pattern. The S&P500 is up 25% YTD.

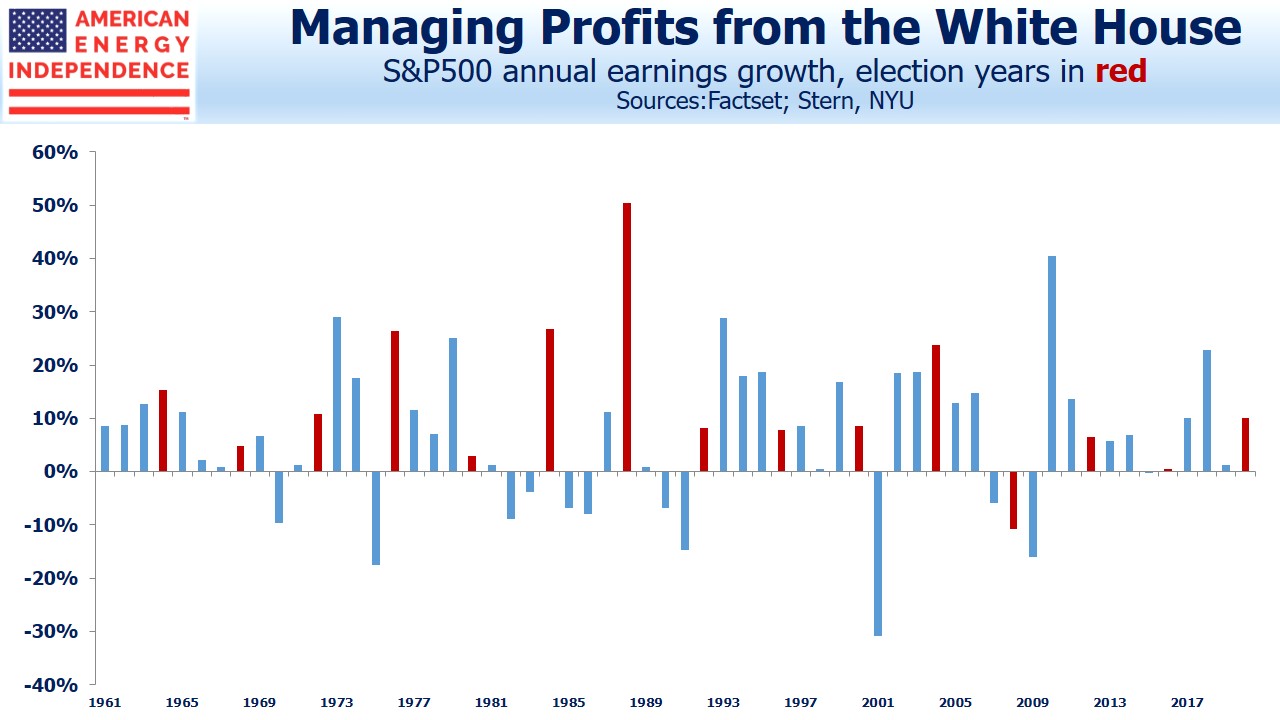
This is probably due in part to the fact that S&P500 earnings growth tends to be stronger than average in election years, and markets being forward-looking tend to anticipate that.

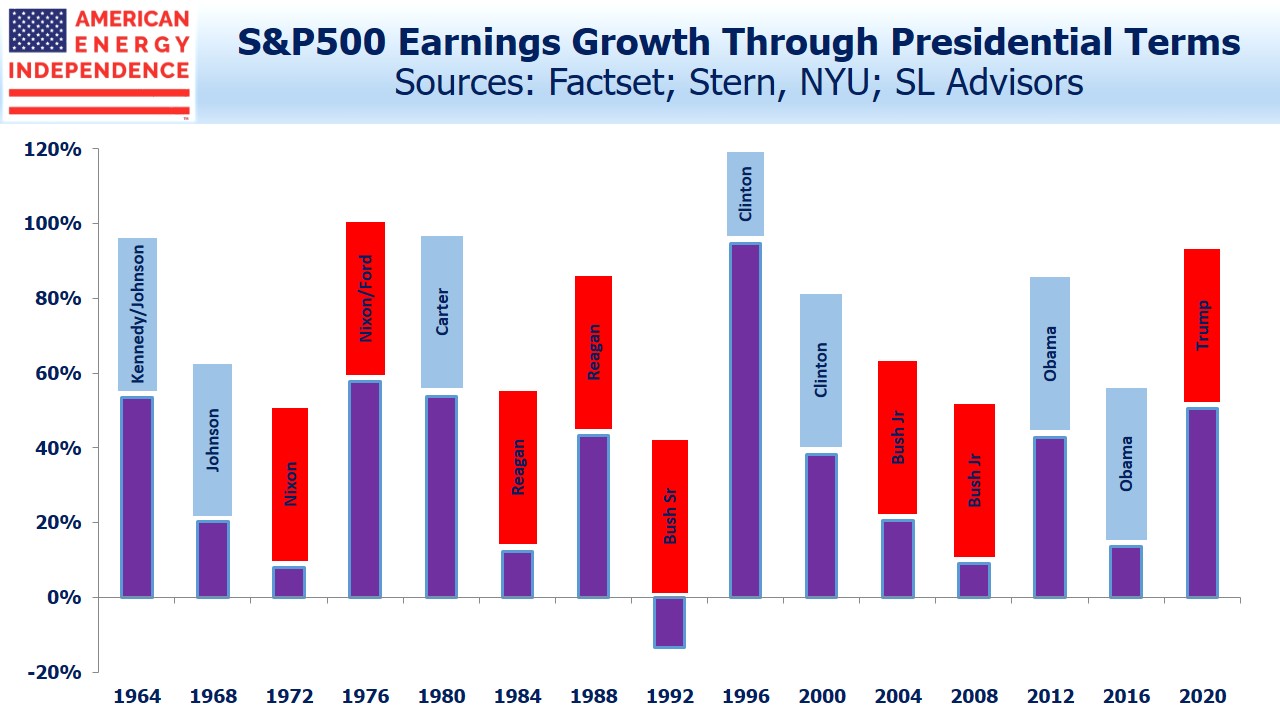
Next year’s anticipated 10% S&P500 earnings growth is above the 8% annual average since 1960, but below the 13% average for election years. The 2017 tax reform, which slashed corporate taxes, boosted 2018 corporate profits, making for tough comparisons this year. But overall S&P earnings are set to be up 50% during this four-year presidential cycle, fifth best out of 15 since 1960. Equity investors have done well.

We won’t offer an election forecast derived from stocks, nor a market return based on next year’s election; there are plenty of better qualified prognosticators. Suffice it to say that the synchronization of corporate profits with the election cycle has continued into 2020. There’s no clear pattern showing one party’s control of the white House is better for S&P500 earnings over another.

The Equity Risk Premium (S&P500 earnings yield minus the yield on ten year treasury notes) has favored stocks for several years. Low interest rates leave equities one of the few asset classes with a chance to deliver returns ahead of inflation. It remains substantially wider than the 60 year average, and 10% earnings growth next year would accentuate the appeal of stocks. The Federal Reserve has gradually accepted the reduced real rate that bond investors have long felt was appropriate (see Real Returns On Bonds Are Gone). Perhaps the biggest unanswered question for investors today is why long term rates around the world are so low, with U.S. the highest among G7 nations. Part of the explanation is inflexible investment mandates (see Pension Funds Keep Interest Rates Low). It’s the most important factor showing stocks are cheap. There are few good alternatives.

Climate Promises from Politicans: America Will Do Better

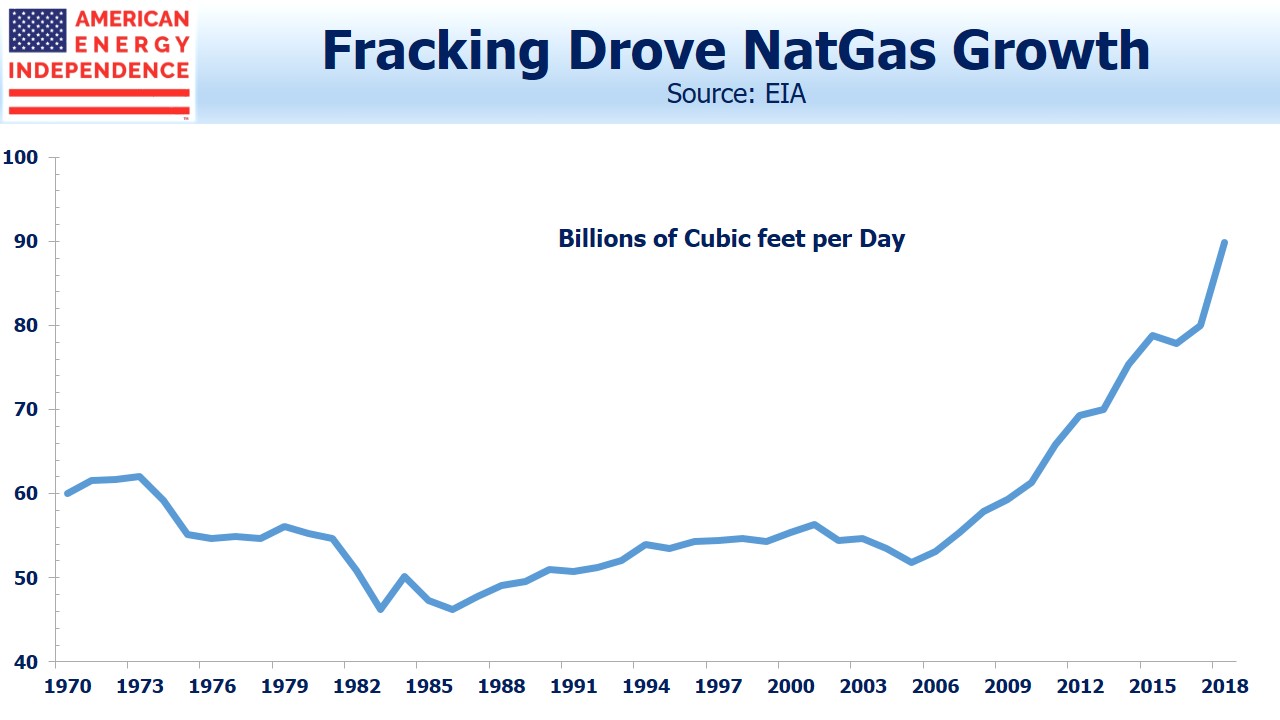
Over 60% of U.S. liquid hydrocarbon production comes via hydraulic fracturing (“fracking”).  This includes 7.75 million Barrels per Day (MMB/D) of crude oil (total 12.4 MMB/D), and three  MMB/D of Natural Gas Liquids (NGLs, including propane and butane) out of five in total. In addition, shale natural gas production  is 68.5 Billion Cubic Feet per Day (BCF/D) from fracking, three quarters of our 91 BCF/D total.

Presidential primaries invite bold promises, and Elizabeth Warren does not disappoint with her pledge to ban all fracking in the U.S., on her first day in office no doubt.

If Warren does become president, such an executive order would reflect democracy in action. So her position is either (1) disingenuous, since such an economically ruinous move is implausible, or (2) reckless, because of the economic consequences.

Presidents are not Emperors. The 2005 Energy Policy Act among others restricts presidents from choosing industries by executive action. Legislation would be required by Congress, although presidential persistence can overcome constitutional checks and balances. The wall being built on our southern border without explicit Congressional funding is an example. Improbable campaign promises can become policy.

Oil markets would adjust to the loss of 10% of global supply, even though excess supply is estimated at only a fifth of this. Warren’s presidency  would open with sharply higher gasoline prices for all Americans, with an outsized impact on lower-income voters many of whom vote Democrat. During the 2008 financial crisis, crude consumption fell by 1.5% and oil fell from $144 to $34 within five months. From 2014-16 crude oil collapsed from $100 per barrel to under $30, and the supply excess was estimated at around 1.5-2%.  Given a sudden supply shortage five times as big, a tank of gas might cost as much as a lightly used iphone.

Natural gas is the biggest source of electricity generation. Heating and a/c bills would soar. Acting like a regressive tax hike, a fracking ban would slow growth and drive unemployment higher. The US$ would weaken, further exacerbating the increase in our trade deficit from importing more crude oil. It would represent a substantial transfer of American wealth to OPEC and Russia.

Many positions taken during primaries are later ditched during the national election. Warren’s sound-bite policy is less extreme than Bernie Sanders, who believes, “Fossil fuel executives should be criminally prosecuted for the destruction they have knowingly caused.” Although this falls short of the “lock ‘em up” characterization of his position, it still represents a chill for those legally supplying what the market wants. Why aren’t energy consumers as culpable as suppliers?

Deep disappointment seems inevitable – most likely for environmental extremists when such promises turn out to be unattainable, but possibly for the rest of us if a new administration seriously pursues them.

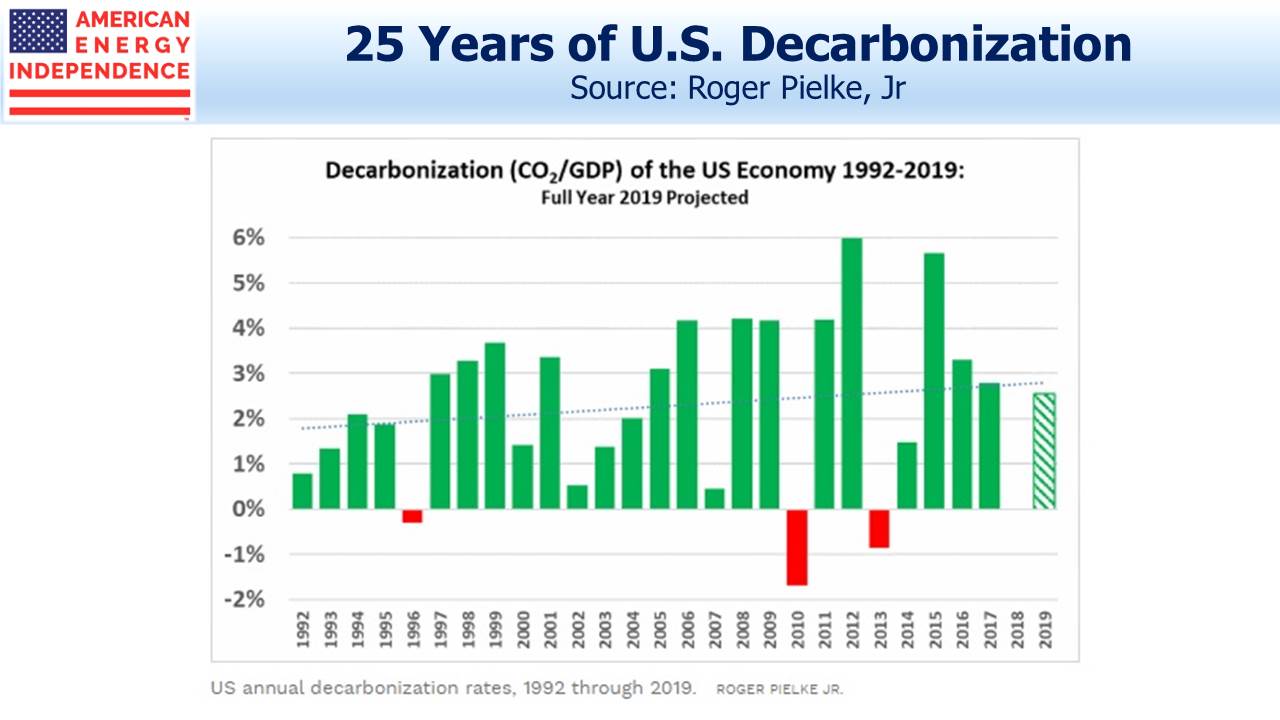
The U.S. economy is decarbonizing, at around 2.3% p.a. over the past 25 years. This means the ratio of CO2 produced to GDP has been falling at this rate. The figures for other developed countries generally fall between 2% and 3% p.a. The global decarbonization rate since 2000 is 1.6% p.a.

PwC estimates that achieving an 80% reduction in CO2 emissions by 2050 (consistent with goal of limiting global warming to 2 degrees Celsius above pre-industrial levels) would require a global decarbonization rate of 6.4%, four times the current rate.

Estimates of Warren’s plan suggest a 9.9% rate of annual improvement, while Bernie Sanders’ requires 15.2%. Sharply curtailed supply of traditional energy is a cornerstone for all Democrat candidates.

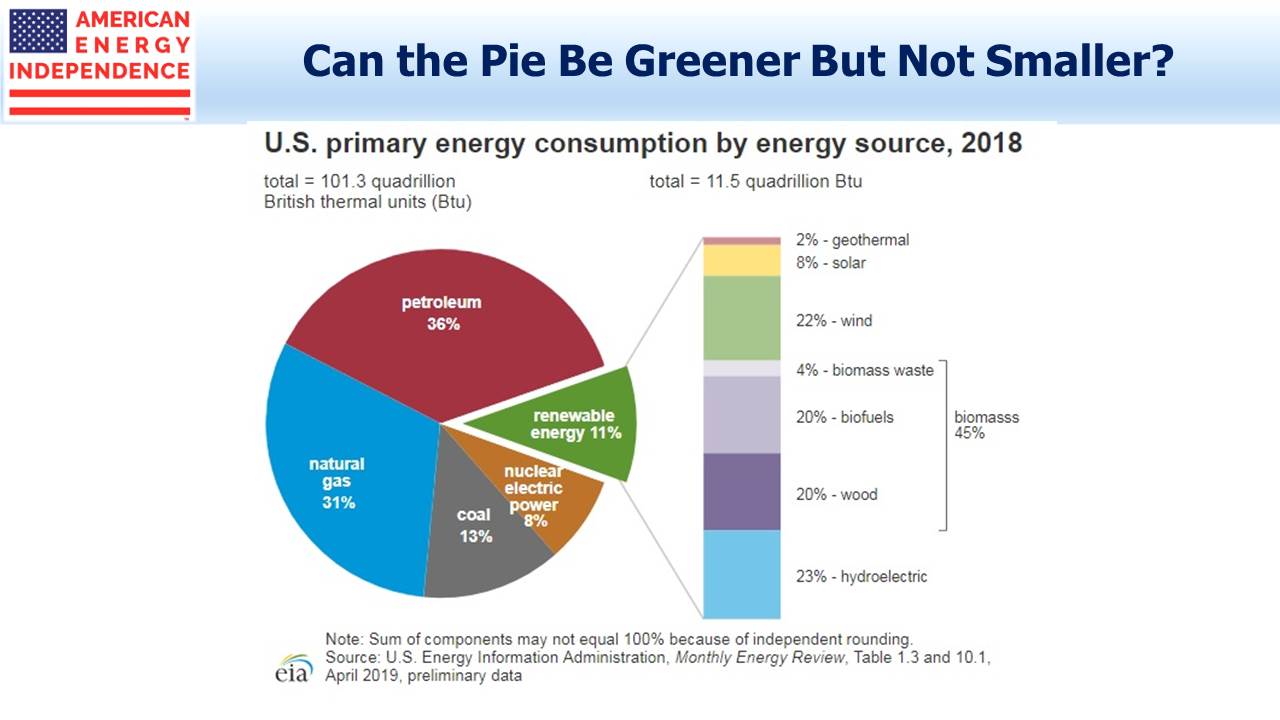
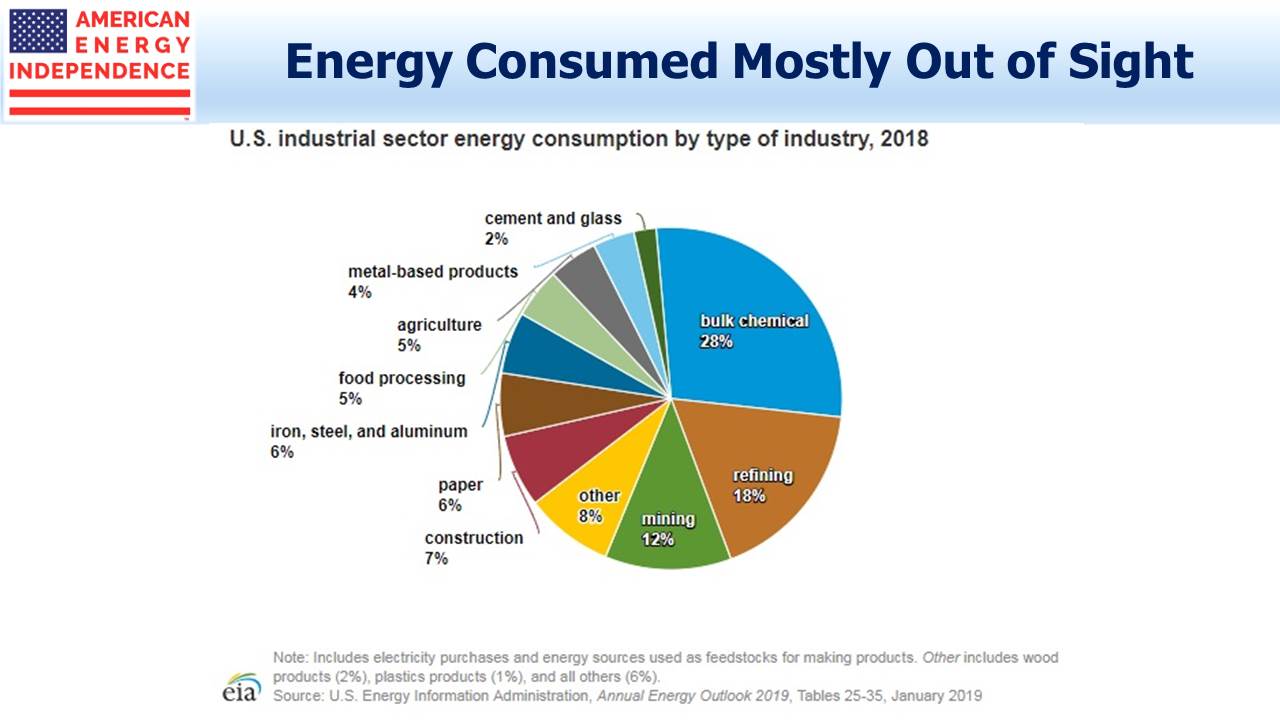
Although climate change extremists focus on transportation, in 2018 in the U.S. this was 28.3 quadrillion BTUs of energy consumption, 28% of the total. Industry used around 26% of our energy, for the production of chemicals, plastics, refining, construction, steel, fertilizer, cement and glass. Much industrial use of energy requires high heat or the chemical composition of fossil fuels, qualities not available with renewables.

The curtailment of steel production has led to one estimate that Sanders’ proposal would require the removal of 200 million cars from U.S. roads by 2030.

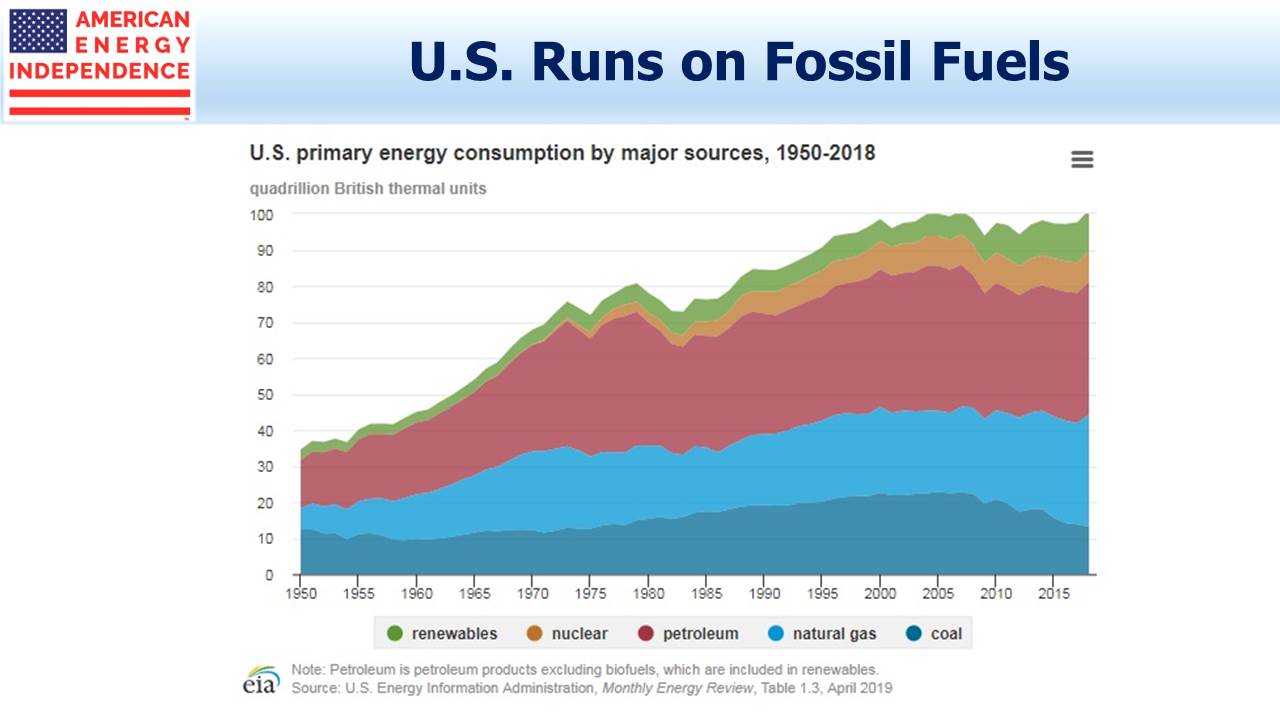
Solutions need to be sound-bite ready, and fit into Twitter’s 280-character limit. This leaves little room for thoughtful discussions of what kind of economy we’ll have with dramatically less steel, glass, cement and fertilizer; why we’re not phasing out every coal plant in favor of natural gas; on the case for common standards and commissioning of nuclear power; and sharply higher R&D into cleaner ways to use what works, which is overwhelmingly fossil fuels.

The world’s cattle produce 5 gigatons of greenhouse gases annually, only slightly less than the U.S. Phasing out cows (meaning ending their reproduction) would eliminate this source of emissions within twenty years (see The Bovine Green Dream), an outlandish suggestion that is nonetheless more practical than the Democrat policy proposals on offer.

There’s no thoughtful discussion of the necessary trade-offs, weighing risks, costs and outcomes. Discourse consists of brief sentences of one and two syllable words. The U.S accounts for just 14% of global emissions. The Democratic primaries have put the most thoughtless solutions on display. Americans deserve better — we should all hope that such extreme policies are abandoned in favor of more thoughtful ones.

Hopes for a Trade Deal Slipping

Article I of the U.S. Constitution gives Congress the “…Power to lay and collect Taxes, Duties, Imposts and Excises…” Congressional control over tariffs has never been so strong since.

The Reciprocal Trade Agreement Act of 1934 granted President Roosevelt the authority to adjust tariffs and to negotiate bilateral trade agreements without prior congressional approval. Other legislation increased the Administration’s control over trade, including the Trade Act of 1974 which allowed the President to impose a 15% tariff if imports threatened national security. There’s much to recommend a single decision maker heading up such negotiations. It should lead to more predictable, less capricious discourse than one requiring congressional approval. For decades, it’s how the U.S. has conducted trade negotiations, and it’s broadly worked.

In recent months, President Trump has demonstrated the full range of options afforded a president to manage trade. Updates on the progress of negotiations with China have been responsible for much of the recent market volatility.

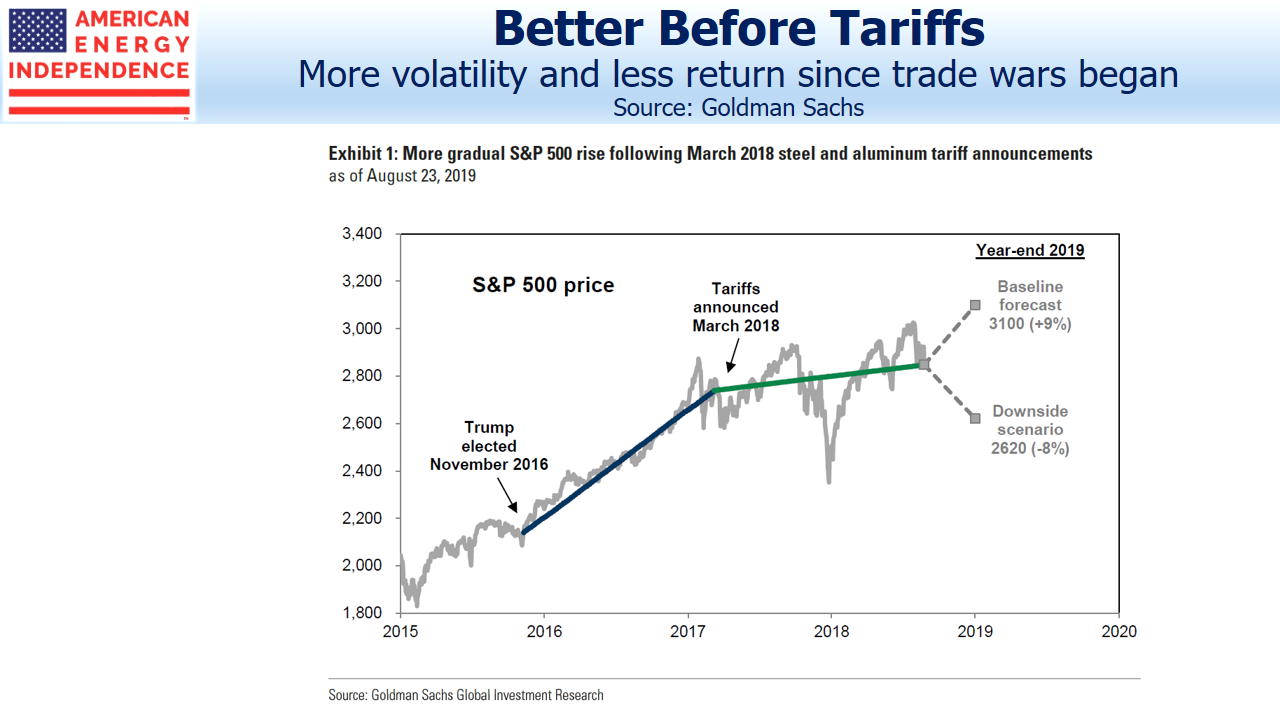
An interesting chart from Goldman Sachs divides the three year performance of the S&P500 into two periods – a steady uptrend that prevailed from Trump’s surprise election until the first imposition of steel tariffs early last year, followed by a modest rise punctuated by higher volatility.

Trade War Increases Market Volatility Lowers Returns

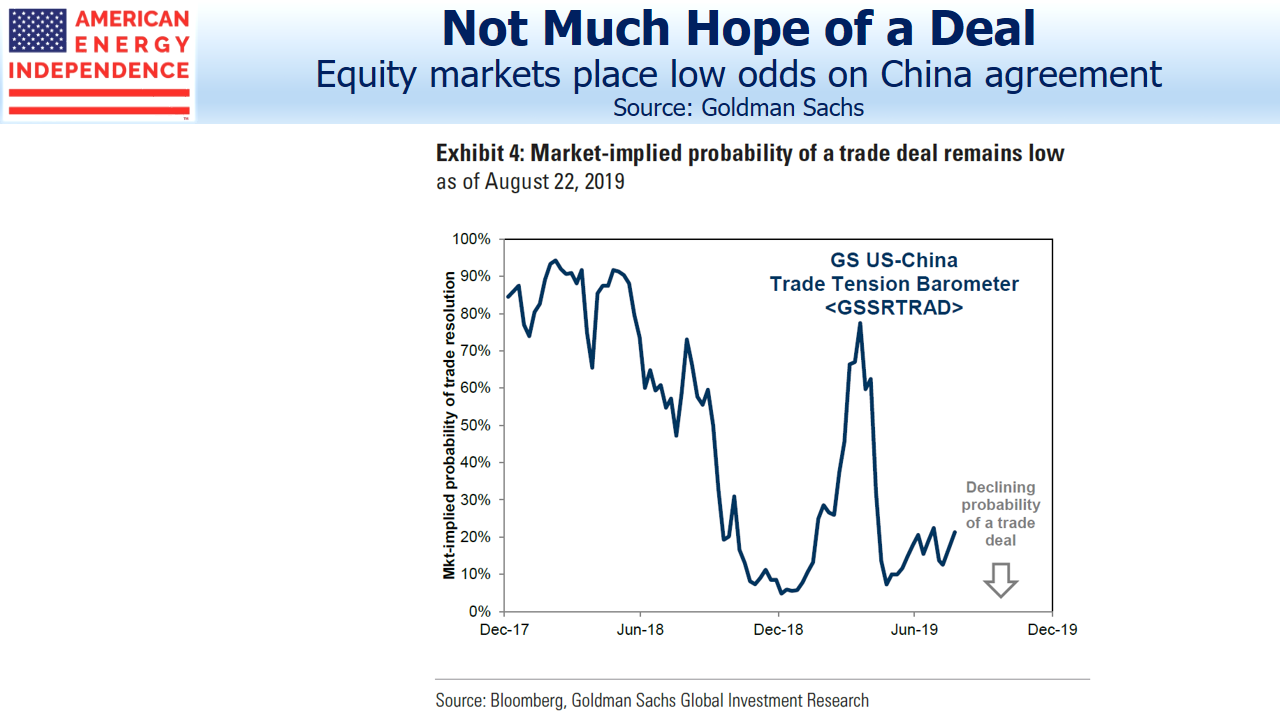
A second Goldman chart infers the market’s estimate of a trade deal by comparing baskets of stocks with sharply different exposure to China. Based on this, market expectations of a trade deal are low, and Goldman duly do not expect one before next year’s election.

Market Places Low Odds on Trade Deal

Stocks are cheap relative to bonds (see Stocks Offer Bond Investors an Opening). It seems self-evident that Trump’s re-election prospects are better without trade disputes slowing growth, and therefore rational for him to seize a deal. The trade deficit with China is already falling (see Trade Wars: End in Sight), so the opportunity to declare victory and reach agreement is a real one.

Low expectations of an agreement coupled with relatively cheap stocks mean a big rally would follow.

But this analysis isn’t unique, and market participants are looking beyond it. Current pricing of no deal before the election either means Trump won’t seize one, or China will decline to offer a graceful exit from a negotiating strategy that hasn’t yet worked.

This brings us back to the issue of which arm of government should control trade negotiations. There’s much to be said for the current structure. Congress is an unwieldy negotiating partner, and myriad parochial interests could easily derail an almost perfect agreement.

If the low expectations of an agreement turn out to be accurate, calls to restore some of the power originally vested in Congress are likely to grow. Senators from both parties have begun advocating for such a change. If protracted trade uncertainty continues into next year, the odds of legislative action will rise.

Paradoxically, such an outcome could well be bullish if it removed much of the trade uncertainty we’re learning to live with. It’s just hard to assess how much intervening market volatility will be required to provoke lawmakers into action.

SL Advisors is the sub-advisor to the Catalyst MLP & Infrastructure Fund.  To learn more about the Fund,  please click here.

SL Advisors is also the advisor to an ETF (USAIETF.com).

Trade Wars: End in Sight

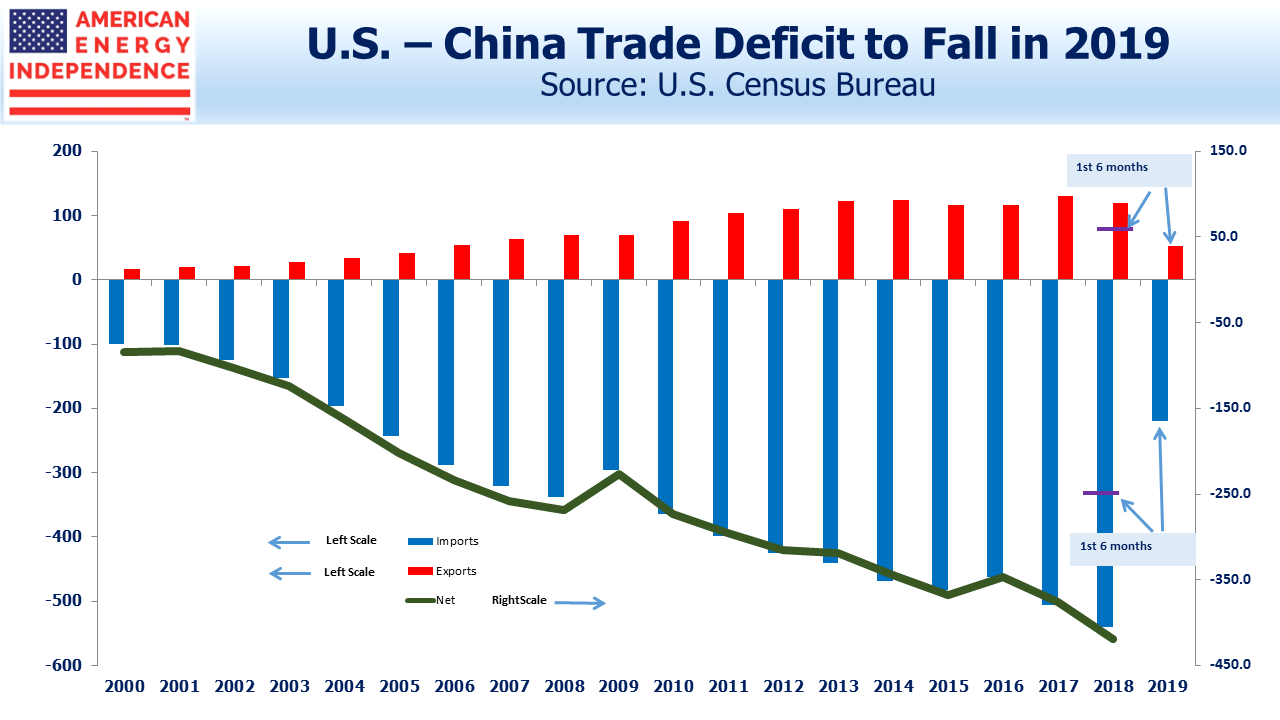
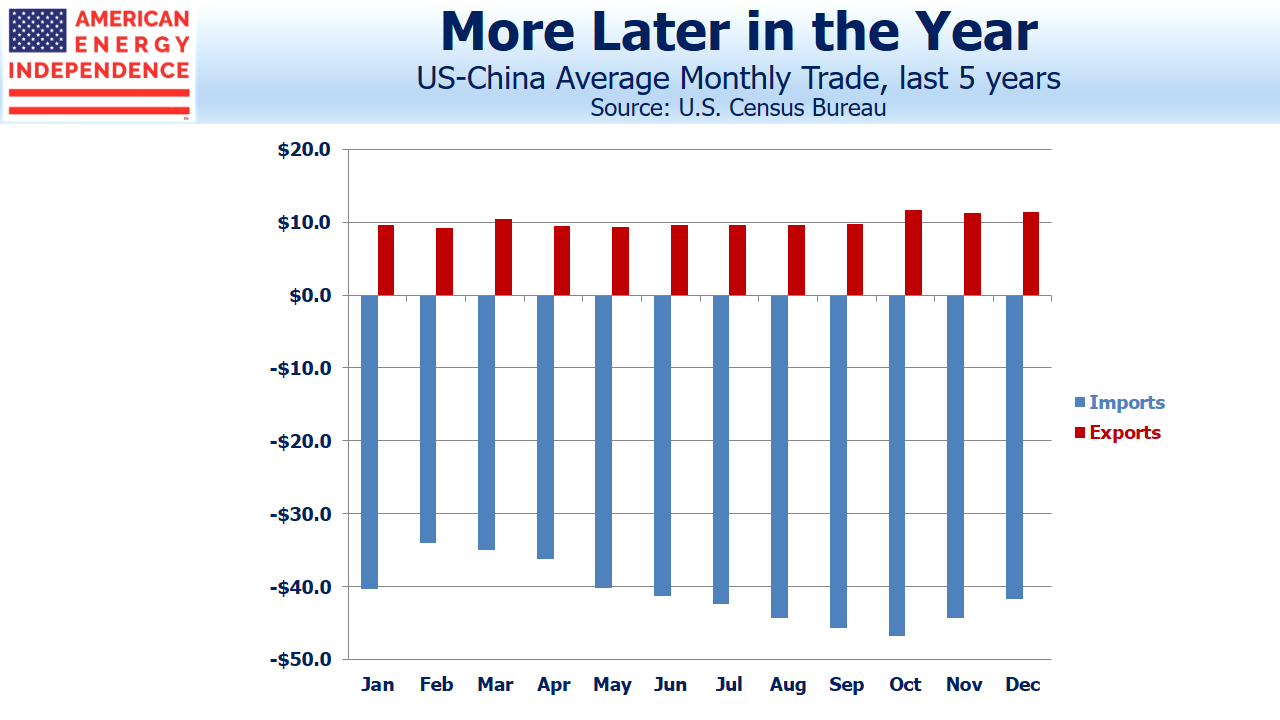
Last week’s fears of global recession herald the late stages of Trump’s trade war. It’s already possible to see the outlines of a triumphant victory speech. The U.S. trade deficit with China is on track to fall for the first time in at least 30 years. After it reached a new record last year, critics were quick to point out the Administration’s failure to resolve an issue that figured prominently in the 2016 campaign. But as the chart shows, unless trade flows for the second half of 2019 follow a dramatically different pattern than in the past, this year will provide the White House with plenty of ammunition heading into the 2020 election.

U.S. China Average Monthly Trade

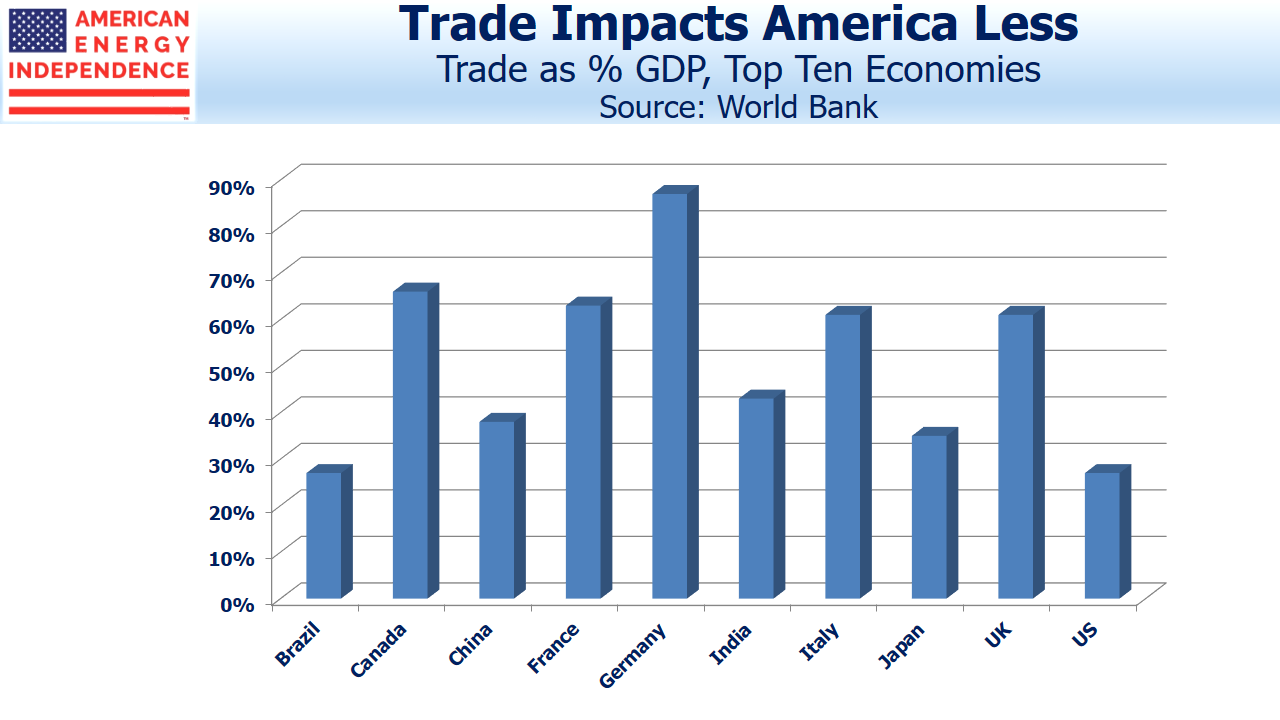
The U.S. always had a stronger hand; America’s vast domestic market means trade penetration is the joint-lowest among the world’s ten biggest economies (tied with Brazil). America has hundreds of world class companies selling goods and services globally. But many thousands more achieve years of growth without having to venture abroad. Compare that with Germany’s vaunted “mittelstand”, of small and mid-size industrial companies that export successfully around the world. Overseas customers are vital to German GDP growth, which is why ongoing trade friction tipped the German economy into contraction during the second quarter.

Trade as a Percentage of GDP

Soybean exports to China represent 10% of all U.S. farm output, so there are regions and industries that have suffered. Consequently, the Administration recently announced $16BN in aid to farmers hurt by Chinese reciprocal tariffs. But the overall result is that U.S. GDP has been less harmed than in other countries. High-tech goods such as aircraft and integrated circuits are among the biggest export categories to China, but since intellectual property is one source of conflict, these industries shouldn’t be surprised if they get caught in the crossfire.

Trump draws widespread condemnation for the manner in which he governs, but in taking on the trade deficit with China he is reflecting the views of many Americans. Since World War II, the U.S. navy has protected vital shipping lanes around the world, facilitating trade and thus promoting global prosperity. Questioning this policy doesn’t resonate with most politicians; but the emergence of other big economies, such as China, to compete with the U.S.suggests that American security policy can be less selfless than in the past.

A more transactional U.S. approach, less drawn to underwriting the greater good prompts simple questions: one is, why does the U.S. maintain troops in Germany as protection from Russia, while Germany increases its imports of Russian natural gas? America has bankrolled military support for many countries rebuilding their economies since World War II. Times are changing.

Bilateral trade deals suit the U.S. Although the White House was widely criticized for withdrawing from the Trans Pacific Partnership (TPP), negotiating within large groups blunts the leverage of the world’s biggest economy. The U.S. benefits from a series of bilateral agreements creating a hub and spoke framework, although most nations do better by coordinating with others.

Last year’s free trade deal with South Korea is an example. More recently, NAFTA was replaced with the US-Mexico-Canada Agreement (USMCA) in a pair of bilateral negotiations with Canada and Mexico that tweaked the old deal to suit the U.S.

It’s why the EU is more popular with smaller countries. Once Britain leaves the EU and opens bilateral trade negotiations with the U.S., it’ll experience the reduced leverage that comes from being outside the group.

The shrinking deficit with China is creating an opening for Trump to reach an agreement, removing the growing headwind slowing global GDP. He can boast of being the first president to interrupt the steadily increasing trade deficit with China. If he doesn’t dwell for too long, he may even head off the recession that investors increasingly fear.

What’s unclear is whether it’s been worth the fight. The U.S. Federal budget deficit relies on financing by foreign investors. Because America doesn’t save enough to meet its borrowing needs domestically, the surplus dollars held by trade partners, including China, get reinvested into U.S. financial assets, such as treasury bonds. A lower trade deficit suggests fewer excess dollars owned by foreigners to be invested. This in turn means more U.S. debt will need to be financed by domestic savers, which will require higher interest rates as an inducement. And even though the U.S. has a strong hand in trade negotiations, slowing GDP growth doesn’t help anyone.

Provoking trade friction may not always be smart policy, but it does reflect popular opinion. It is democratic. Trump’s critics are many, but he is a reflection of American views on trade.

SL Advisors is the sub-advisor to the Catalyst MLP & Infrastructure Fund.  To learn more about the Fund,  please click here.

SL Advisors is also the advisor to an ETF (USAIETF.com).

Art of the Tariff

Yesterday’s White House announcement that newly imposed tariffs on Chinese goods would be delayed three months sent stocks higher. The trade dispute hasn’t hurt the U.S. that much, although there’s widespread evidence of financial distress among farmers. Agriculture Secretary Sonny Perdue showed his sledgehammer wit in a joke aimed at farmers complaining about tariffs. China recently stopped buying U.S. agricultural products entirely in response to the latest U.S. tariffs. Farmers vote, and the White House has modestly recalibrated its approach. Trump clearly enjoys the relatively unfettered freedom of action afforded the president on trade.

Trade friction threatens global growth. The IMF recently called for a quick resolution between the U.S. and China. It’s blamed for the continuing drop in bond yields, with some investors openly contemplating whether the U.S. could soon join other developed country sovereign debt with negative interest rates. U.S. ten year yields of 1.7% are the highest in the G7, and among those who shop for value in government bond markets they probably look enticing.

America’s higher yields reflect our relative immunity to trade war fallout. The S&P500 recently broached 3,000 for the first time before retreating on new tariffs. But yesterday’s bounce took it back to within 3% of recent al-time highs. We noted last week how the Equity Risk Premium provided a compelling case for investors to allocate towards risk assets (see Stocks Offer Bond Investors an Opening).

America Shielded from Trade War

Although Trump’s protracted dispute with China has broad domestic support, we continue to believe that a resolution will be found within the next few months, so as to avoid any economic fallout in an election year. Expect to see agricultural exports and natural gas heralded as big winners.

The U.S. energy sector could certainly use a confidence boost. Pipeline earnings have generally been at or ahead of expectations. The bull story relies on the growth in free cash flow (see The Coming Pipeline Cash Gusher). 2Q19 earnings reports provided further confirmation that growth projects peaked last year, leaving more cash available for dividend hikes.

Traders betting on a global slowdown are quick to short crude oil, and recent weakness in energy prices has hurt the sector’s stocks too. No matter that pipeline company earnings are generally not sensitive to commodity prices. The most asked question by clients recently centers around the incongruity of good operating performance with falling stock prices. The short answer is that several years of dividend cuts left income-seeking investors betrayed. So far this year, this traditional buyer hasn’t rushed back, as shown by flows into retail-oriented funds.

Improving fundamentals and compelling valuations are attracting private equity buyers. Public market buyers will surely follow.

SL Advisors is the sub-advisor to the Catalyst MLP & Infrastructure Fund.  To learn more about the Fund,  please click here.

SL Advisors is also the advisor to an ETF (USAIETF.com).

Brexit Meets the Shale Revolution

Britain’s new prime minister, Boris Johnson, sports a mop of blond hair, shuns conventionality and routinely spins facts to suit his purpose. The photo is from a 2006 charity soccer game in London against Germany, when he head-speared an opponent in a maneuver better suited to wrestling. It’s an appropriate metaphor for the upcoming Brexit negotiations with the EU.

Boris Johnson Rugby Tackle

Even to a Brit, the unfolding constitutional drama has been hard to comprehend. Boris was chosen by 96,000 hard-core Conservative party members, and will be PM because they (barely) have a Parliamentary majority. The country voted for Brexit (by 52%-48%), and yet Parliament has rejected both a negotiated EU exit and a hard Brexit. It’s possible the next deadline of October 31 may pass with the UK still a reluctant EU member.

Poor leadership is all Britain has. If Theresa May wasn’t all but gone, she would have faced more withering criticism over the entanglement with Iran. Having seized an Iranian tanker, the careless loss of a British-flagged ship might charitably be ascribed to domestic leadership distractions. The inability of the Royal Navy to offer protection, along with Britain’s intimidating vow to resolve using all diplomatic means, reveals a country wrestling with diminished status and no plausible military option.

PM Johnson enters office with an unwanted foreign policy crisis. But as a vocal cheerleader for Brexit, it is appropriate that he should be the one leading the country as it plows ahead into unknown status.

Meanwhile, the main protagonists are both avoiding direct conflict — Iran because military defeat would be swift, and Trump because it would jeopardize his re-election. So the situation percolates without boiling over, with little end in sight.

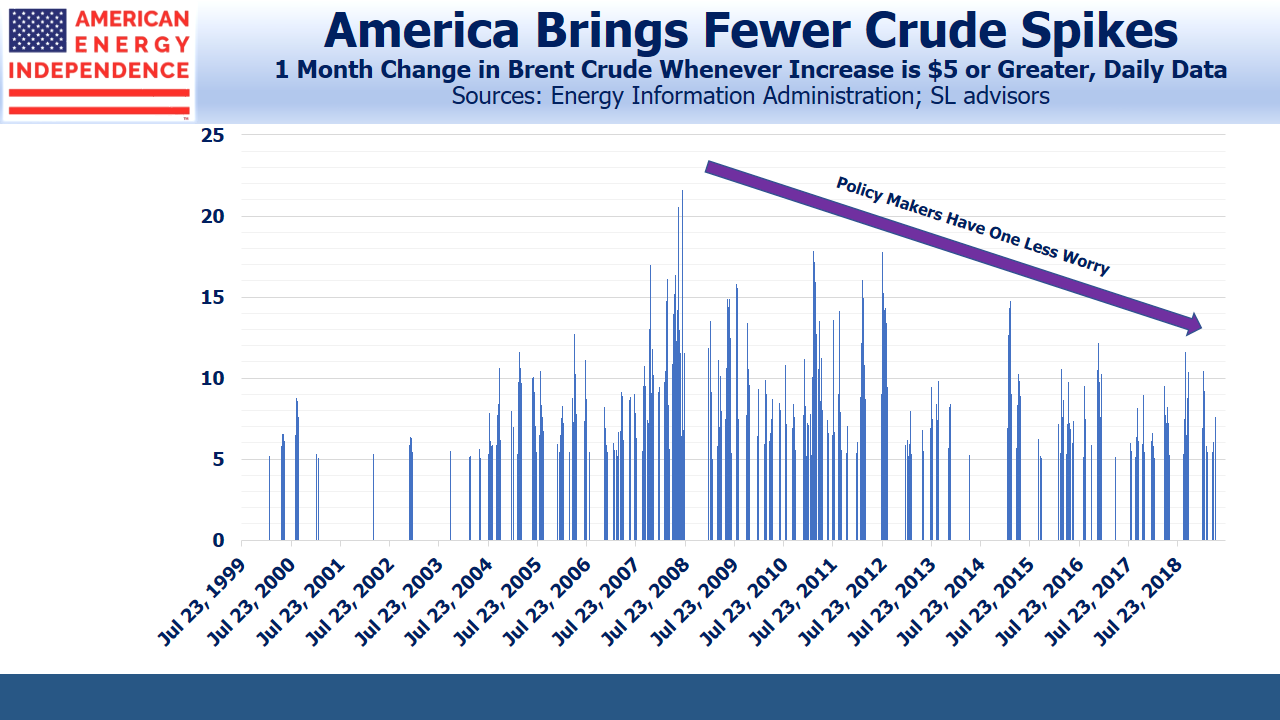
Crude traders have remained sanguine over the potential for supply disruption through the Straits of Hormuz. A defining feature of the Shale Revolution is that it has ameliorated the price spikes that used to threaten global growth. Higher prices increase profitably accessible reserves, and shale’s short production cycle always promises more availability within a matter of months, if needed.

Fewer Monthly Spikes in Crude Oil

Britain’s economy is slowing due to Brexit uncertainty. Shaky consumer confidence doesn’t need a debilitating spike in crude. Fortunately, such moves are becoming rarer. Volatility in crude oil isn’t much different than a decade ago, because prices still fall quickly. But world growth is more susceptible to sharp increases. Encouragingly, price spikes are becoming less frequent and milder, another tangible demonstration of the Shale Revolution’s impact in addition to generally lower prices.

President Trump could justifiably note how American energy independence is protecting oil importing nations like Britain from price shocks. PM Johnson needs a narrowing Atlantic to offset the politically widening English Channel.

U.S. LNG exports, another Shale Revolution benefit, are likely to be on the table as Brexit Britain seeks deeper ties with the U.S., allowing Trump to show he can close a trade deal. A Donald-Boris honeymoon beckons.

SL Advisors is the sub-advisor to the Catalyst MLP & Infrastructure Fund.  To learn more about the Fund,  please click here.

SL Advisors is also the advisor to an ETF (USAIETF.com).

Our Fossil Fuel Future (With a Bit More Solar and Wind)

Climate change is driving tremendous upheaval in the energy sector. One consequence is that making long term investments is exceptionally difficult. A large, conventional oil or gas project is exposed to uncertainties around GDP growth, production costs and commodity prices over a payback period that can extend 10 to 20 years or more. Public policy changes add further uncertainty, which is why big projects are shrinking, and investments with a faster payback are gaining favor. The short-cycle projects offered by U.S. shale are one answer to energy production at a time of uncertainty.
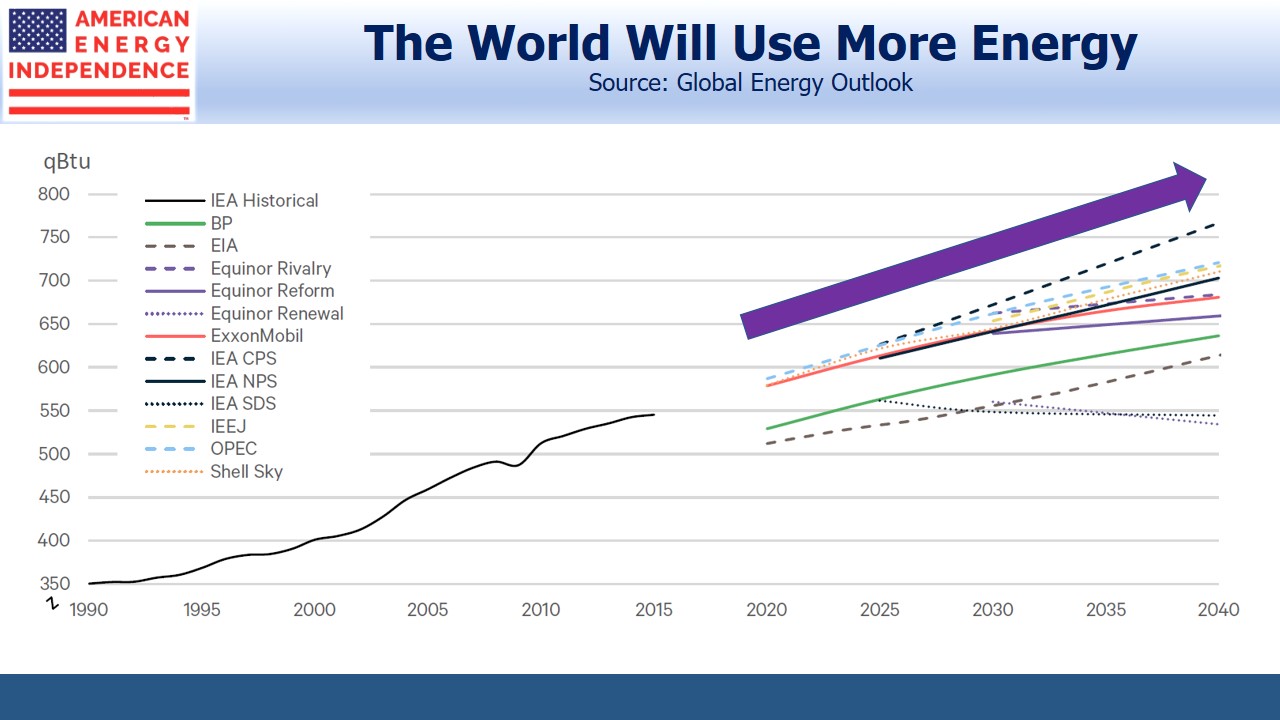
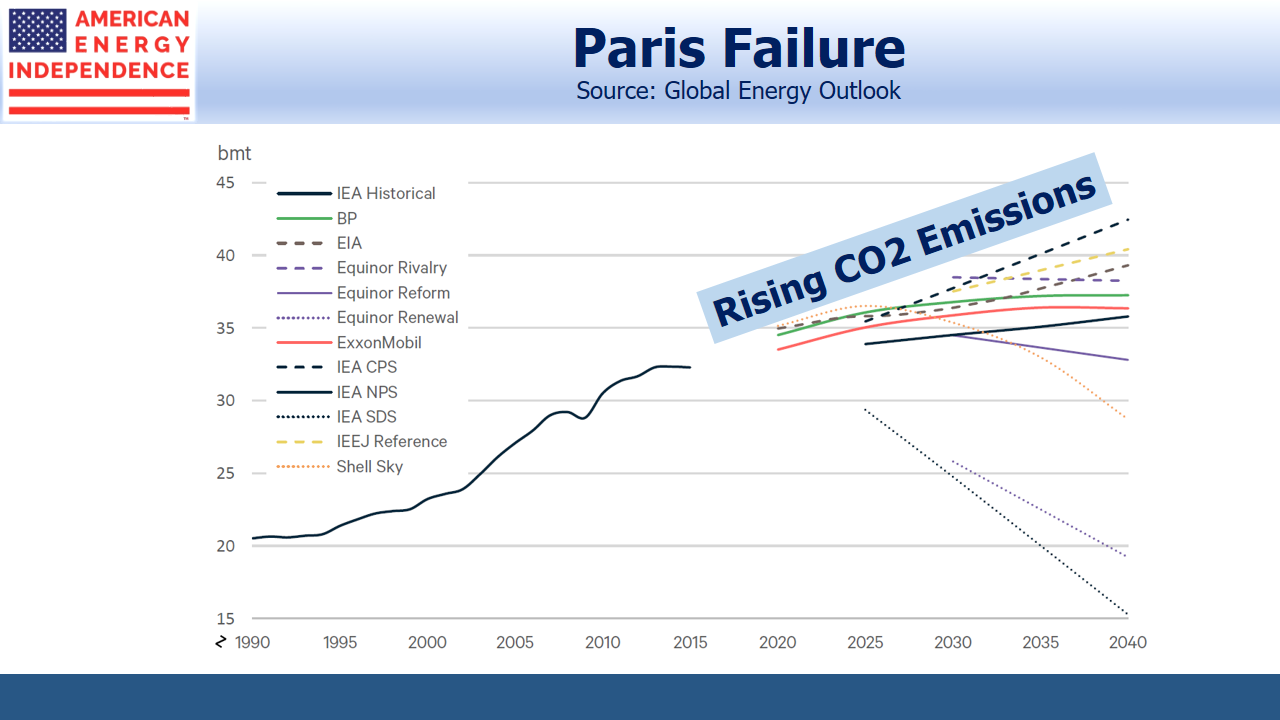
There are at least seven entities publishing projections on long term global energy use, and because of multiple scenarios they produce 13 forecasts. Resources for the Future, a non-profit research institution, has helpfully combined these in Global Energy Outlook 2019: The Next Generation of Energy (“GEO”) so as to allow easy comparison. These fall into three categories of energy consumption to 2040 based on different public policy regimes: (1) unchanged policies, (2) likely new policies, and (3) policies designed to lower CO2 emissions.

The World Will Use More Energy

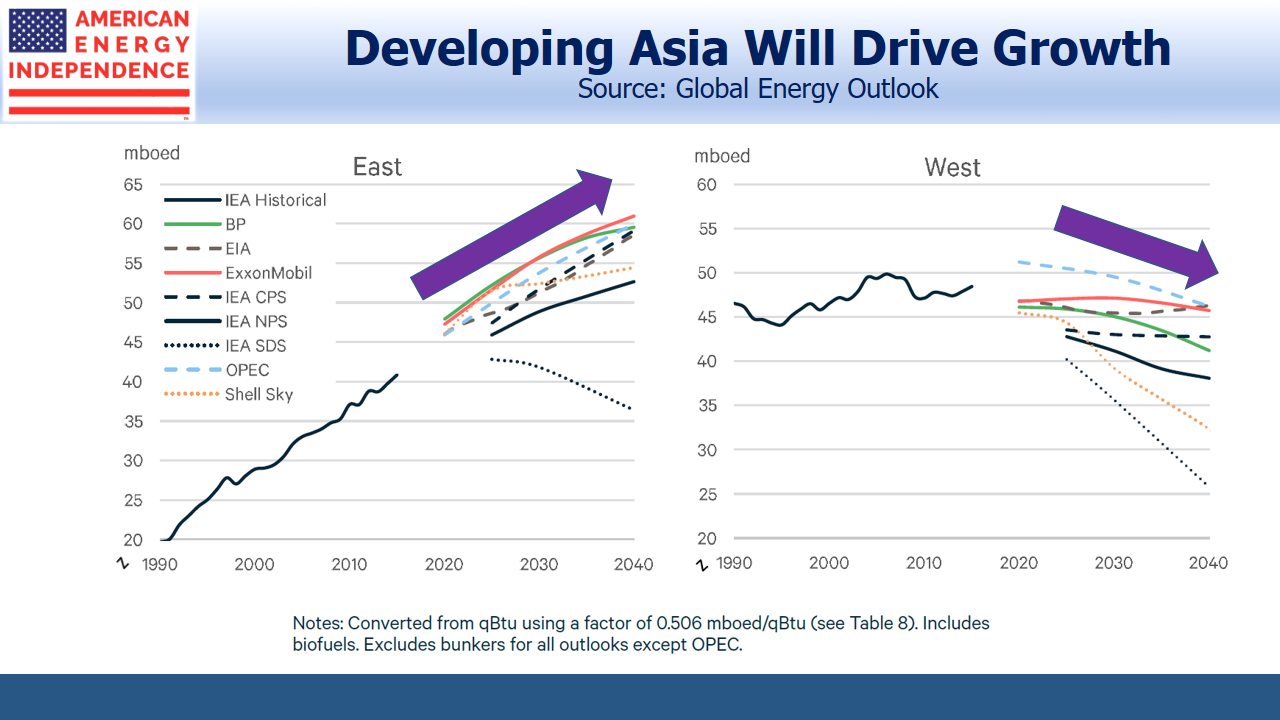
Surprisingly given the diverse set of forecasts and long horizon, there is reasonable consensus in some key areas. Energy consumption will continue to grow, driven by rising living standards in developing countries and increased population. Lowering CO2 emissions pits wealthy countries (“West” in GEO terminology, meaning Europe, Eurasia, North America, South and Central America) willing and able to constrain energy use against the aspiration to western living standards in non-Japan Asia (“East” in GEO which is Asia-Pacific but includes Africa and the Middle East). An estimated 1.1 billion people don’t have access to electricity today.

Asia Will Drive more Growth in Energy Consumption

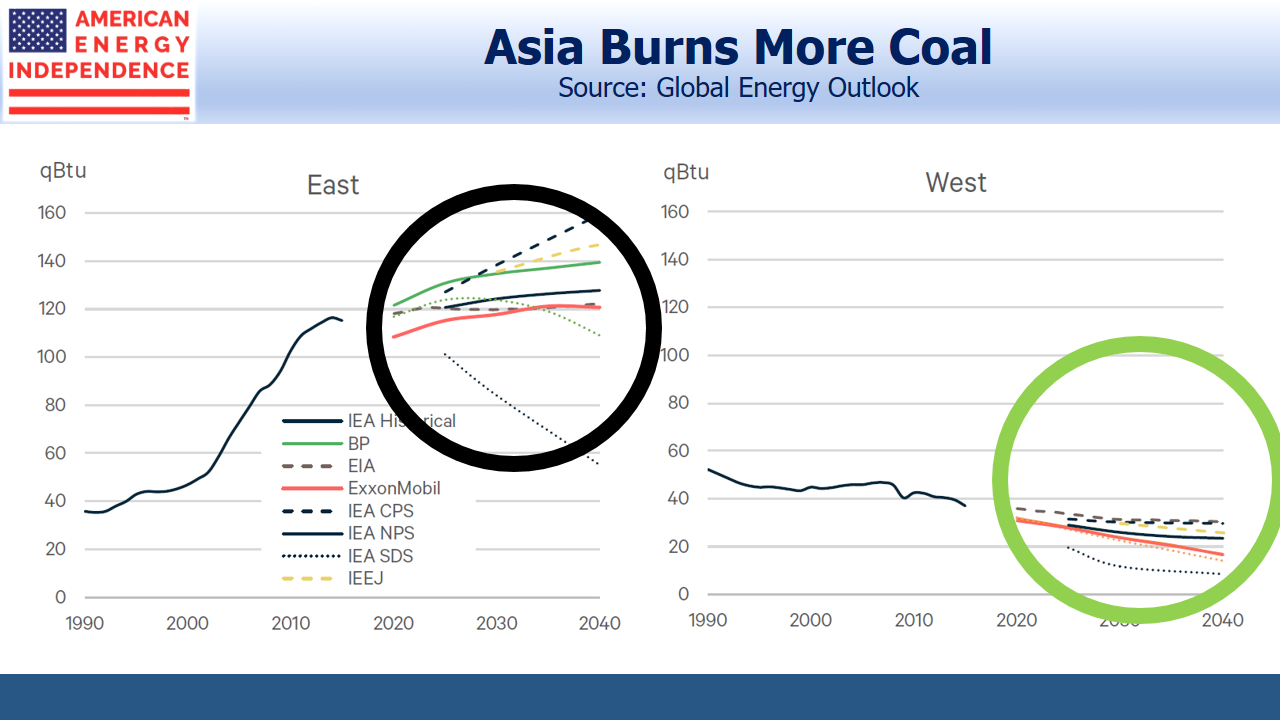
Consumption of oil and related liquids reflects greater auto ownership, aviation and plastics use in the East, more than offsetting improved efficiencies which will curb demand in the West. But the bigger challenge remains global coal consumption, where East and West are moving in opposite directions. China alone burns 6X as much coal as the U.S.  In fact, China consumed more coal last year than the rest of the world combined.  Any path to reduced climate change with today’s technologies includes sharply reduced coal consumption.

Asia Burns More Coal

Substitution of natural gas for coal underpins our constructive outlook for U.S. exports of Liquified Natural Gas (LNG). Even on current policies most GEO forecasts see steady growth in natural gas. If the countries of the East decide to use less coal than most forecasts expect,LNG should see additional demand growth.

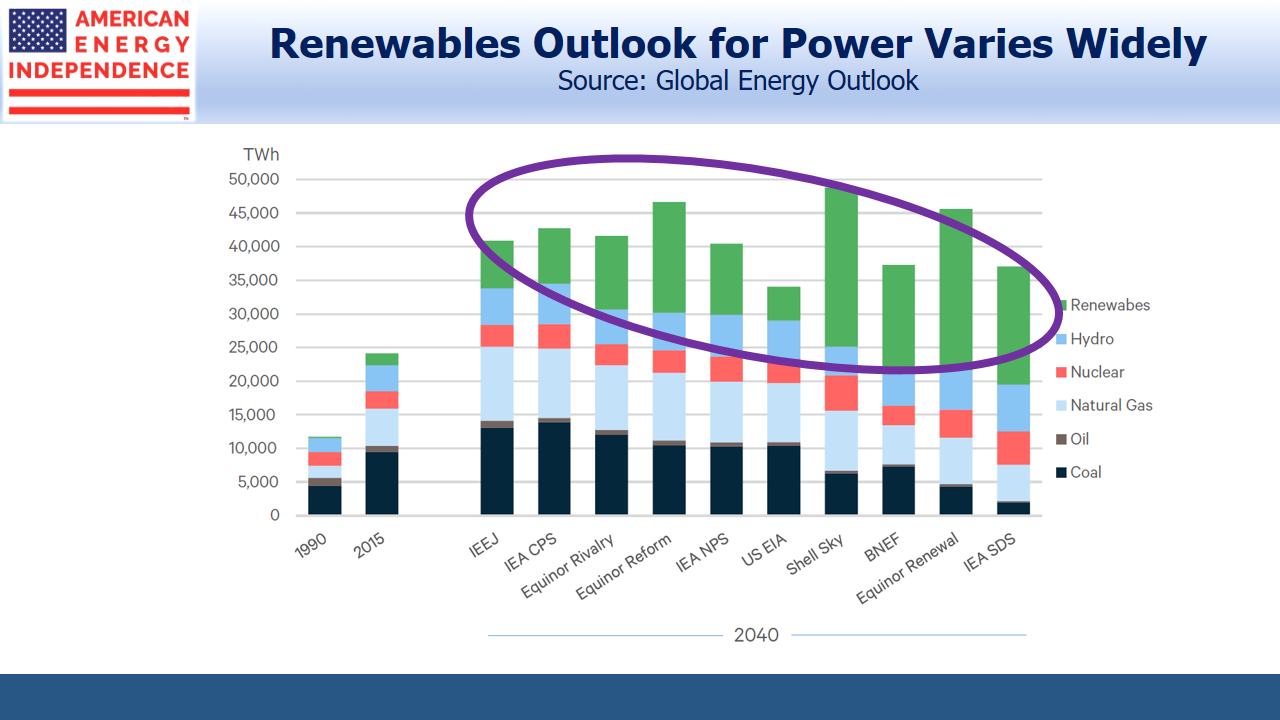
Renewables Outlook For Power Varies

By contrast with natural gas, views on renewables vary widely. The International Energy Agency’s “Sustainable Development Scenario”, which incorporates policies to lower CO2 emissions, sees 4X as much renewable power generation as the U.S. Energy Administration’s “Reference Case”.

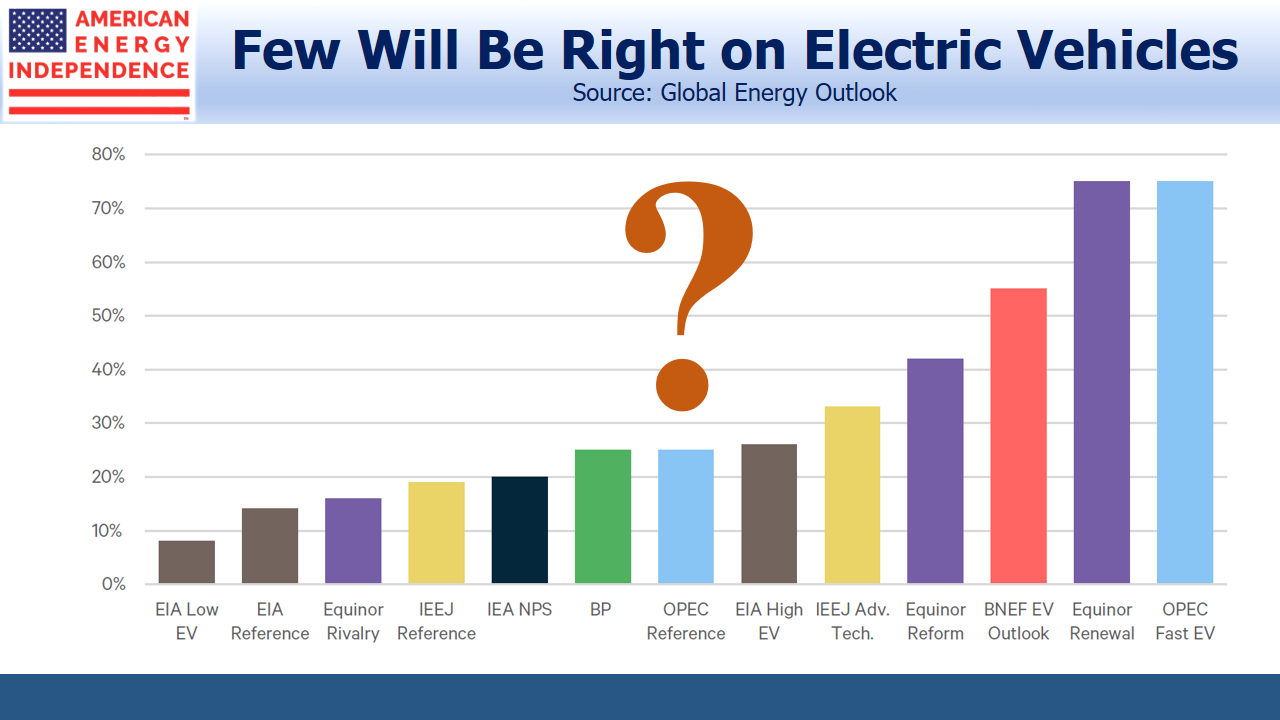
EV Forecasts Vary

Electric vehicles (EVs) are marketed as a reduced CO2 solution, although when you properly account for emissions in their manufacture and battery disposal, the benefits are murky. It also depends on how the electricity used is generated. Wyoming relies exclusively on coal, making a Tesla purchase in the Cowboy State an environmentally unfriendly choice. Estimates of global EV penetration in two decades vary widely.

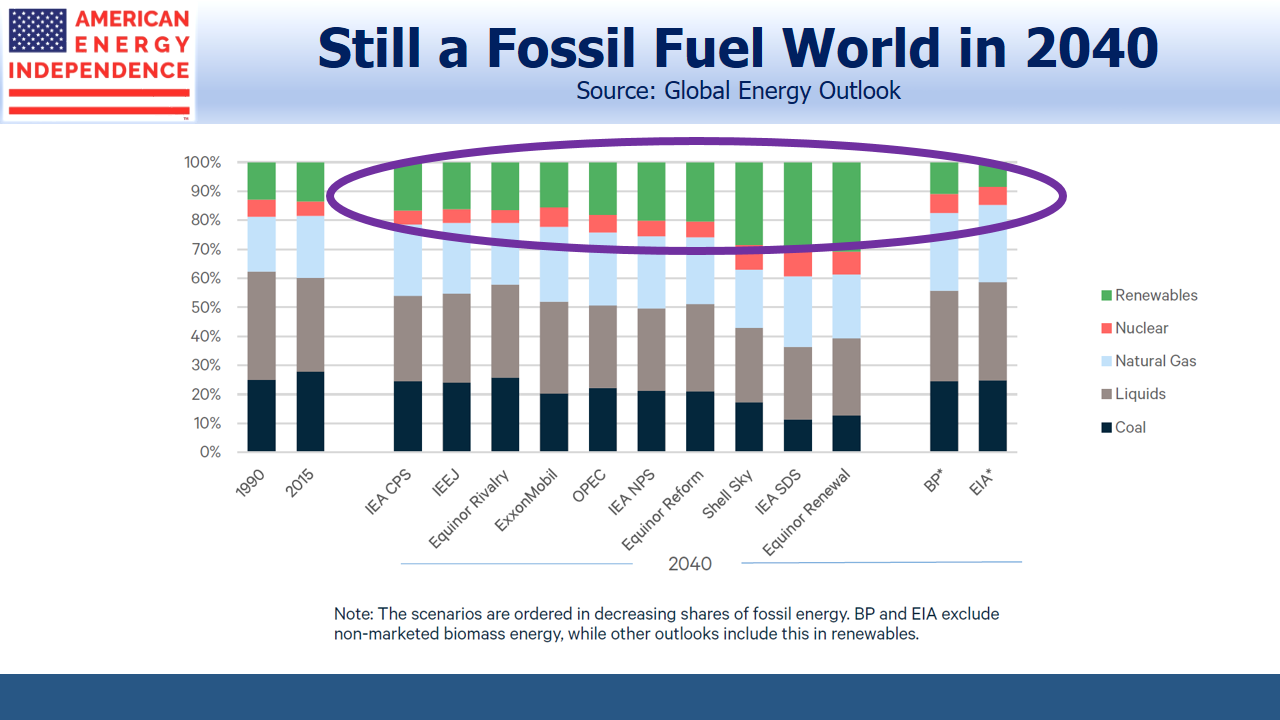
Still a Fossil Fuel World

Most of the promise of renewables lies in their generation of clean power, and electrification of the world’s energy consumption is part of any attempt to tackle climate change. But the production of steel, cement, fertilizer and plastics rely on the high heat generation and other chemical properties of fossil fuels. Aviation is unlikely to use batteries in the foreseeable future. The result is that renewables penetration of total primary energy is expected by most forecasts to increase modestly,  to around 20%.

The conflict between energy use and emissions is shown in the three forecasts that incorporate reduced CO2. Two of them assume falling energy consumption, which seems politically implausible for countries of the East barring transformational improvements in the technology around energy use and storage.

Every energy investor needs to stay current on trends and developments in energy use. The GEO report is a useful reference guide.

SL Advisors is the sub-advisor to the Catalyst MLP & Infrastructure Fund.  To learn more about the Fund,  please click here.

SL Advisors is also the advisor to an ETF (USAIETF.com).

image_pdfimage_print