Drilling Efficiencies, Crestwood and More Energy Transfer-Williams Shenanigans
Drilling Efficiencies
A week or so ago the Energy Information Agency (EIA) released the results of a survey showing the average cost to drill and complete a well in four of the major producing regions in the U.S. As the EIA chart shows, costs were rising going into 2012, but thereafter started to fall and maintained that trajectory as exploration and production companies aggressively sought improved efficiency from their technology and their service providers. 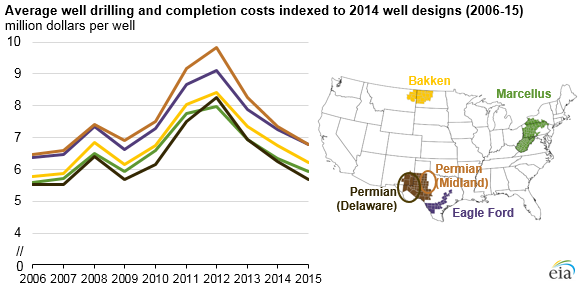
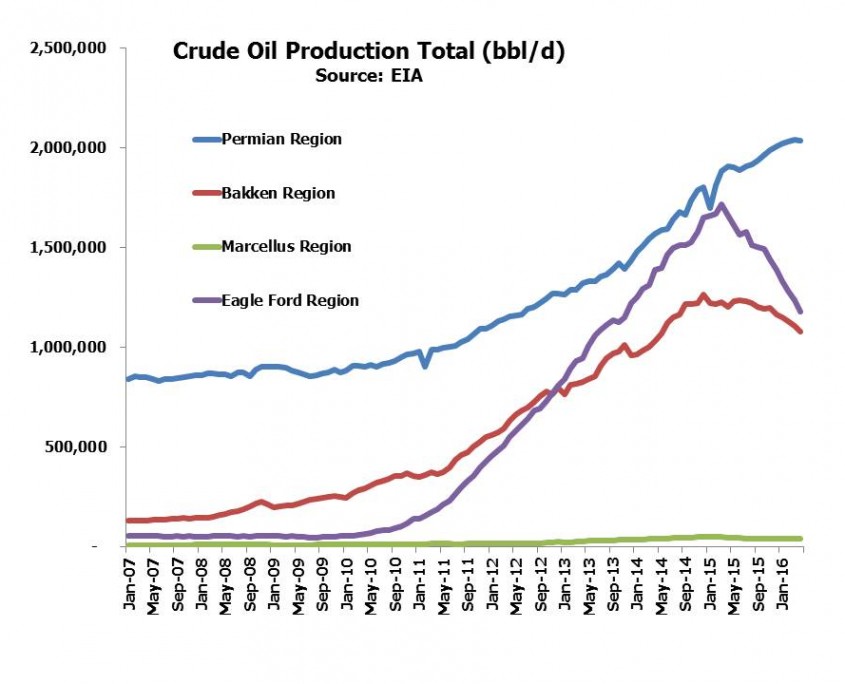
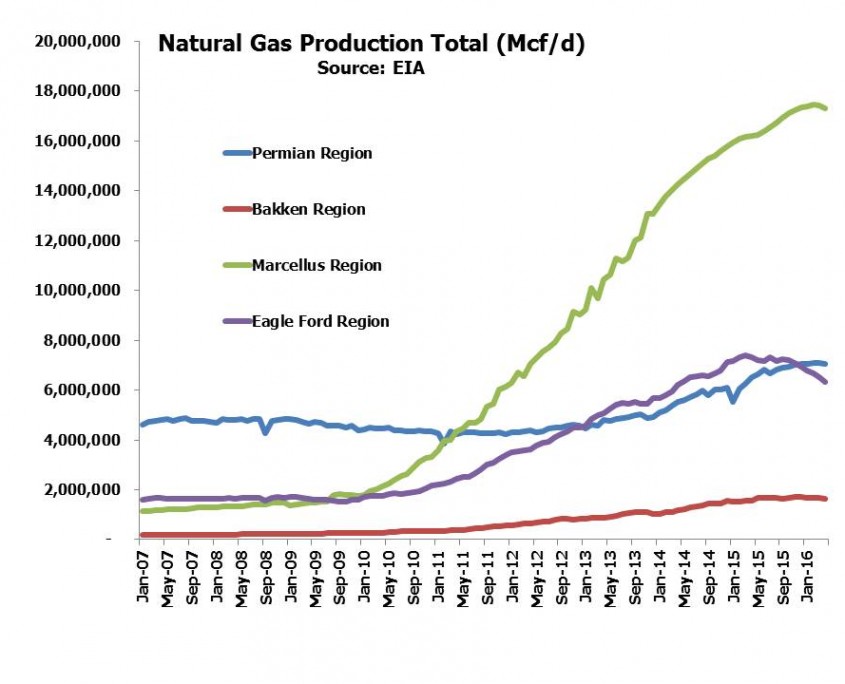
Although this drop in well costs has obviously been good news for the E&P industry (albeit less so for their service providers) it has been complemented by greater output per well. Using data from the EIA’s Drilling Production Report we have created the four subsequent charts, showing, respectively, output per rig for crude oil and natural gas, and total production of crude oil and natural gas, for each of the four regions highlighted by the EIA. Reduced costs to complete a well might accommodate lower average production per well, but in fact the reverse has generally been happening which has allowed IRRs (Internal Rates of Return) to remain substantially more attractive than would otherwise have been the case.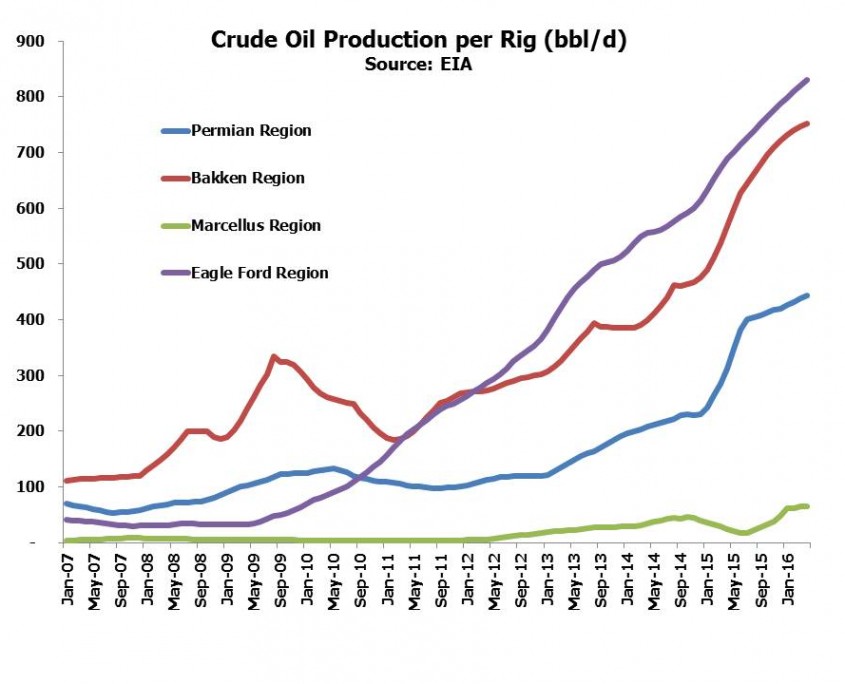
Natural gas production efficiency has improved dramatically in the Marcellus, which has caused the north east U.S. to switch from being a natural gas importer to an exporter and has begun to displace supplies from eastern Canada.
This is why crude oil and natural gas production have only fallen appreciably in the Eagle Ford, where higher initial production rates of new wells (due to higher pressure) are more than offset by faster decline rates than in other regions.
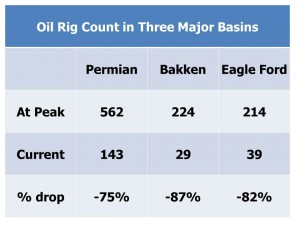
Natural gas output has soared in the Marcellus, aided by falling costs and a more than five-fold increase in output per rig since 2010. And meanwhile the rig count has come down sharply, as the table shows (Source:EIA).
This all represents a fantastic example of American technological innovation rapidly responding to the collapse in crude oil, probably faster than most observers had any reason to expect. Who would want to bet against continued American advances and improvements in this sphere?
Crestwood
A couple of months ago we wrote about Crestwood Equity Partners (CEQP), in The Math of a Distribution-Financed Buyback. Quicksilver is a bankrupt E&P company that had asked the bankruptcy court to reject Crestwood’s contract to provide gathering and processing services. There isn’t much case history of courts resolving contractual disputes between MLPs and their customers, but the travails of many domesric drillers has certainly drawn attention to this aspect of the MLP business model.
On Wednesday, Crestwood announced they had signed a ten year agreement to provide such services to BlueStone Natural Resources, the acquirer of Quicksilver’s Barnett Shale acreage. Previously shut-in wells will be re-opened and the contract, which consists of both fixed-fee and percent of proceeds terms, commits BlueStone to refrain from constraining production for economic reasons through the end of 2018.
It’s just one contract out of tens of thousands across the industry, but its constructive resolution highlights the symbiotic relationship between E&P companies and their infrastructure providers.
Energy Transfer and Williams
Last week we wrote about the Energy Transfer-Williams Poker Game and further twists in the plot took place since then as Williams (WMB) sued Energy Transfer (ETE) and CEO Kelcy Warren for violating the merger agreement when they issued convertible securities only to ETE management. There are no sympathetic characters here, but one can already hear the WMB lawyer explaining in court that WMB initially rejected ETE’s overtures, then finally agreed and is simply seeking to close the transaction on the agreed upon terms. Or, ETE pursued WMB in spite of being rejected, finally got the deal they wanted and have now changed their minds.
I guess Kelcy Warren has earned the right to blunder; while it’s impossible to forecast a resolution, it’s becoming a little hard to envisage a happy combination of these two companies under present circumstances. The uncertainty represents a substantial pall over both stock prices; a grudging break-up payment from ETE to WMB might well be the outcome that lets both managements focus on their operating businesses and brings this sorry, absorbing episode to a conclusion.
One solution that distribution loving MLP investors will find almost unbearable to even ponder is for ETE to scrap the preferred offering, close the deal per the original agreement and suspend the distribution. With $4BN a year in cash flow at the pro-forma parent the $6BN cash payout would be retired in a year and a half with investors looking at a combined company trading at 3x cash flow with conservative leverage.
We are long CEQP, ETE and WMB.

Important Disclosures
The information provided is for informational purposes only and investors should determine for themselves whether a particular service, security or product is suitable for their investment needs. The information contained herein is not complete, may not be current, is subject to change, and is subject to, and qualified in its entirety by, the more complete disclosures, risk factors and other terms that are contained in the disclosure, prospectus, and offering. Certain information herein has been obtained from third party sources and, although believed to be reliable, has not been independently verified and its accuracy or completeness cannot be guaranteed. No representation is made with respect to the accuracy, completeness or timeliness of this information. Nothing provided on this site constitutes tax advice. Individuals should seek the advice of their own tax advisor for specific information regarding tax consequences of investments. Investments in securities entail risk and are not suitable for all investors. This site is not a recommendation nor an offer to sell (or solicitation of an offer to buy) securities in the United States or in any other jurisdiction.
References to indexes and benchmarks are hypothetical illustrations of aggregate returns and do not reflect the performance of any actual investment. Investors cannot invest in an index and do not reflect the deduction of the advisor’s fees or other trading expenses. There can be no assurance that current investments will be profitable. Actual realized returns will depend on, among other factors, the value of assets and market conditions at the time of disposition, any related transaction costs, and the timing of the purchase. Indexes and benchmarks may not directly correlate or only partially relate to portfolios managed by SL Advisors as they have different underlying investments and may use different strategies or have different objectives than portfolios managed by SL Advisors (e.g. The Alerian index is a group MLP securities in the oil and gas industries. Portfolios may not include the same investments that are included in the Alerian Index. The S & P Index does not directly relate to investment strategies managed by SL Advisers.)
This site may contain forward-looking statements relating to the objectives, opportunities, and the future performance of the U.S. market generally. Forward-looking statements may be identified by the use of such words as; “believe,” “expect,” “anticipate,” “should,” “planned,” “estimated,” “potential” and other similar terms. Examples of forward-looking statements include, but are not limited to, estimates with respect to financial condition, results of operations, and success or lack of success of any particular investment strategy. All are subject to various factors, including, but not limited to general and local economic conditions, changing levels of competition within certain industries and markets, changes in interest rates, changes in legislation or regulation, and other economic, competitive, governmental, regulatory and technological factors affecting a portfolio’s operations that could cause actual results to differ materially from projected results. Such statements are forward-looking in nature and involves a number of known and unknown risks, uncertainties and other factors, and accordingly, actual results may differ materially from those reflected or contemplated in such forward-looking statements. Prospective investors are cautioned not to place undue reliance on any forward-looking statements or examples. None of SL Advisors LLC or any of its affiliates or principals nor any other individual or entity assumes any obligation to update any forward-looking statements as a result of new information, subsequent events or any other circumstances. All statements made herein speak only as of the date that they were made. r
Certain hyperlinks or referenced websites on the Site, if any, are for your convenience and forward you to third parties’ websites, which generally are recognized by their top level domain name. Any descriptions of, references to, or links to other products, publications or services does not constitute an endorsement, authorization, sponsorship by or affiliation with SL Advisors LLC with respect to any linked site or its sponsor, unless expressly stated by SL Advisors LLC. Any such information, products or sites have not necessarily been reviewed by SL Advisors LLC and are provided or maintained by third parties over whom SL Advisors LLC exercise no control. SL Advisors LLC expressly disclaim any responsibility for the content, the accuracy of the information, and/or quality of products or services provided by or advertised on these third-party sites.
All investment strategies have the potential for profit or loss. Different types of investments involve varying degrees of risk, and there can be no assurance that any specific investment will be suitable or profitable for a client’s investment portfolio.
Past performance of the American Energy Independence Index is not indicative of future returns.
Leave a Reply
Want to join the discussion?Feel free to contribute!