MLPs: This Time Is Different

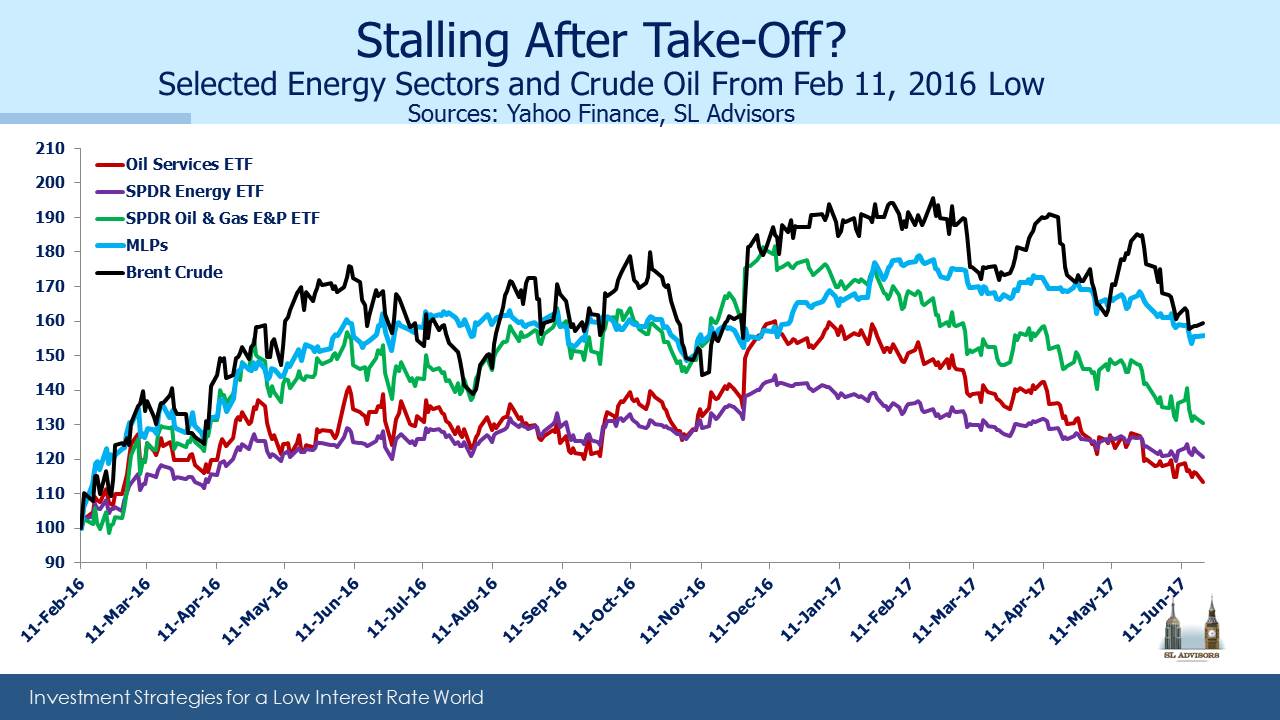
It’ll be no surprise to MLP investors that the correlation of our asset class with crude oil has been rising. Falling crude in 2015 led MLPs to drop 58.2% from high to low, a figure we won’t soon forget. That same institutional memory among investors is imposing a similar relationship today. Last time, lower oil led to lower U.S. production, posing challenges for midstream infrastructure businesses with surplus capacity. This time, higher U.S. production is leading to lower crude prices. In This Time Is Different, Reinhart and Rogoff take readers through the many financial disasters that befell investors who thought it was different. And yet, with due deference to the aforementioned luminaries, we think it is.

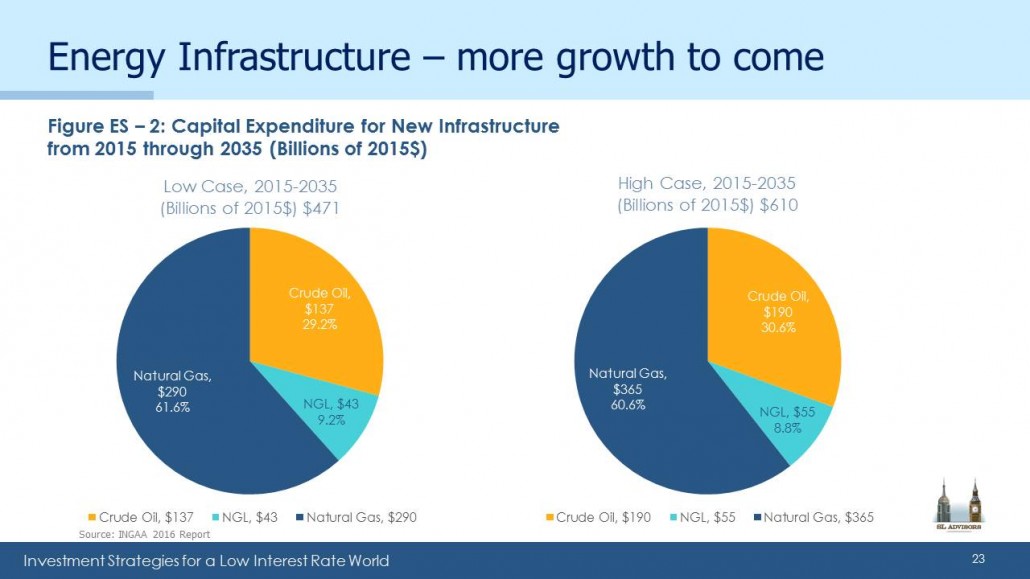
Last week we received more questions than usual from investors reviewing the mark-to-market damage inflicted by their MLP allocations. One investor noted that MLPs were responsible for fully all of the YTD losses in one model portfolio they run. If you’re wondering whether the relentless sellers possess an insight you’re missing, you have plenty of company. Higher production of hydrocarbons in the U.S. is bad for lots of players including OPEC, but it’s hard to fathom why it’s bad for the domestic infrastructure that supports the Shale Revolution. American shale oil output is on track to grow by 1 Million Barrels a Day (MMB/D) annually. Shale output of 5.4 MMB/D is now more than half of total U.S. oil production of 9.3 MMB/D, in a global oil market that’s producing 98 MMB/D.  Furthermore, the fact that U.S. shale producers are growing production at ever lower costs is more likely bad for the other 95% of global producers.

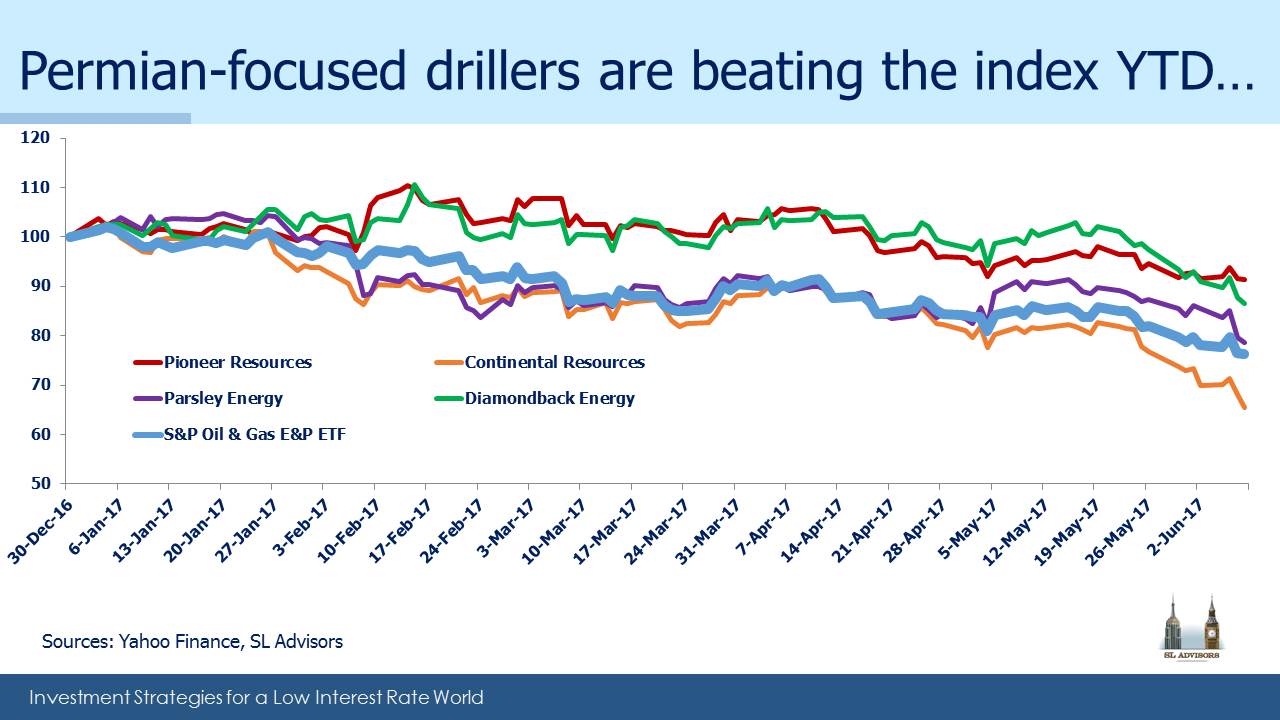
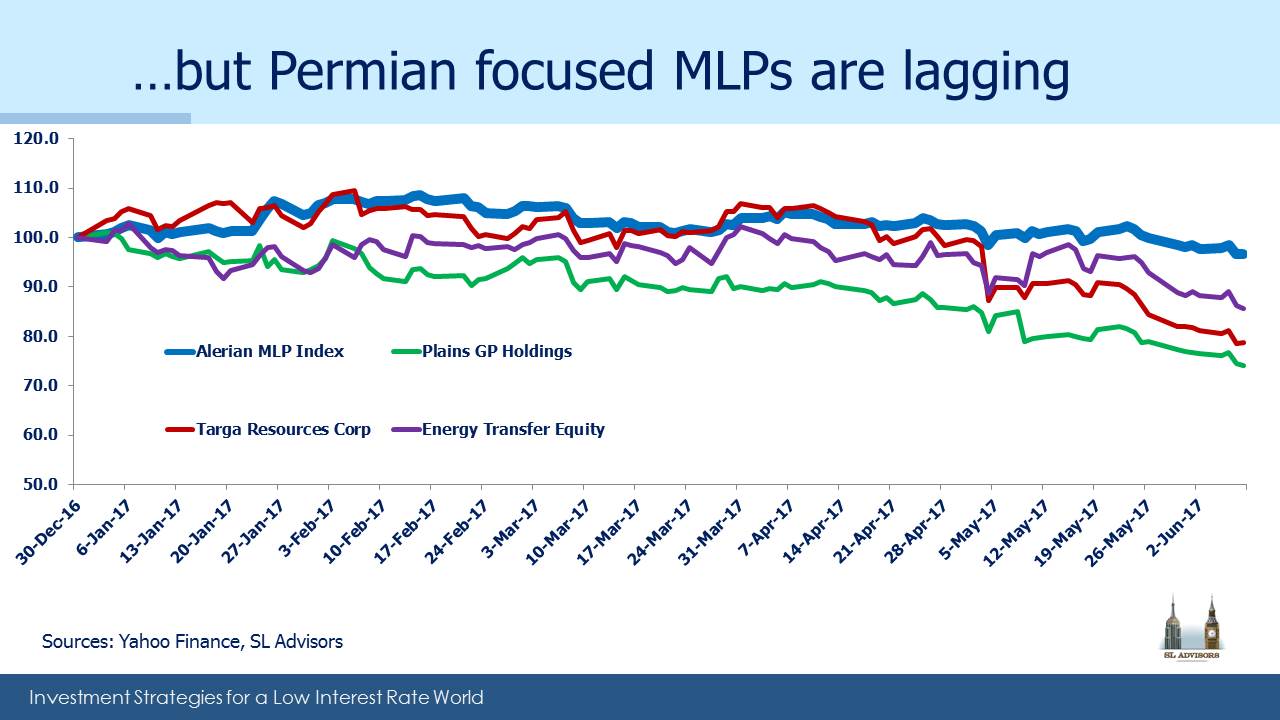
The market is failing to differentiate U.S midstream energy companies that benefit from this growth in market share from the rest of the global energy losers.  At the annual MLPA Conference in Orlando a few weeks ago, MLP managements were similarly puzzled by the weakness in their stock prices. But they were far less worried than most investors, because they generally don’t need to tap the capital markets much to finance their growth plans.

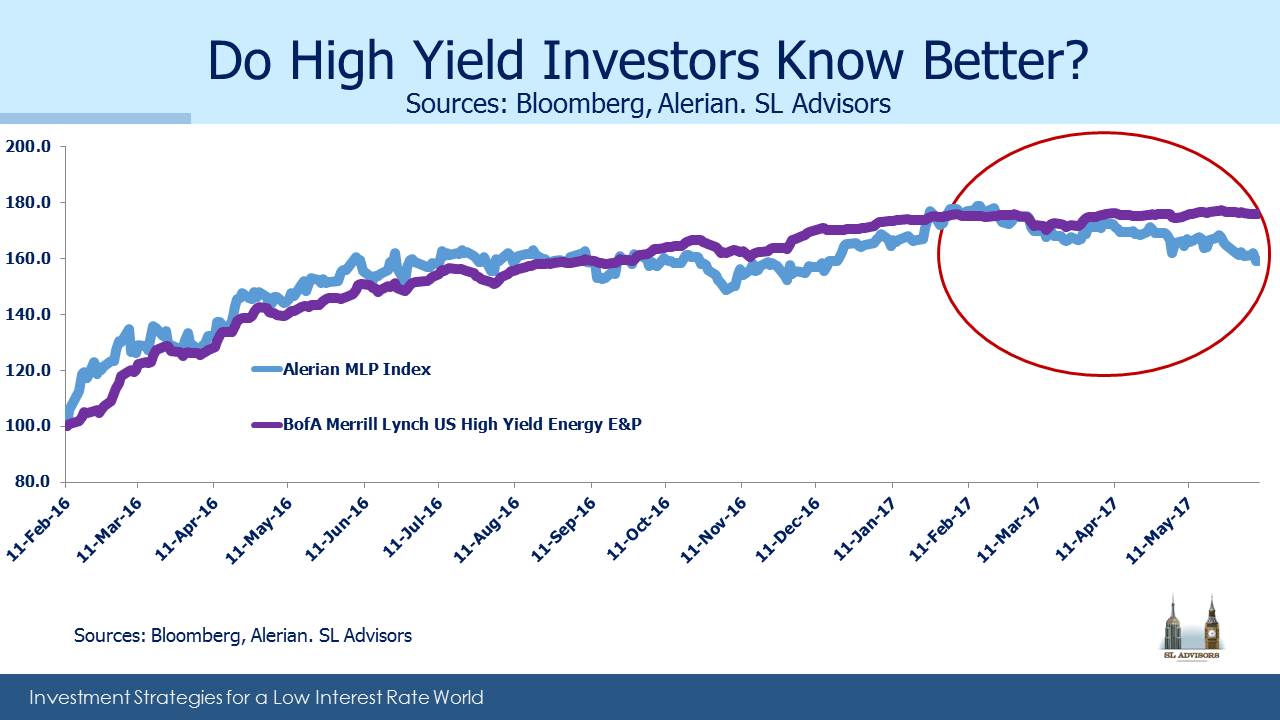
It’s hard to find research that is bearish on MLPs, which is not especially comforting from a contrarian standpoint. The most negative case is probably the view that crude is going to $30 and will take MLPs lower with it. Before ascribing some additional insight to sellers, remember that over $40BN of retail money accesses the asset class inefficiently via taxable, C-corp funds such as AMLP (see Some MLP Investors Get Taxed Twice). Our investors, self-selected as they are, are an intelligent bunch. But they (you) are not representative of an investor base that includes those who accept a 35% corporate tax drag on their returns. Investment insight is going to be rare among this subset, and based on published fund flows they are responsible for some portion of the recent selling.

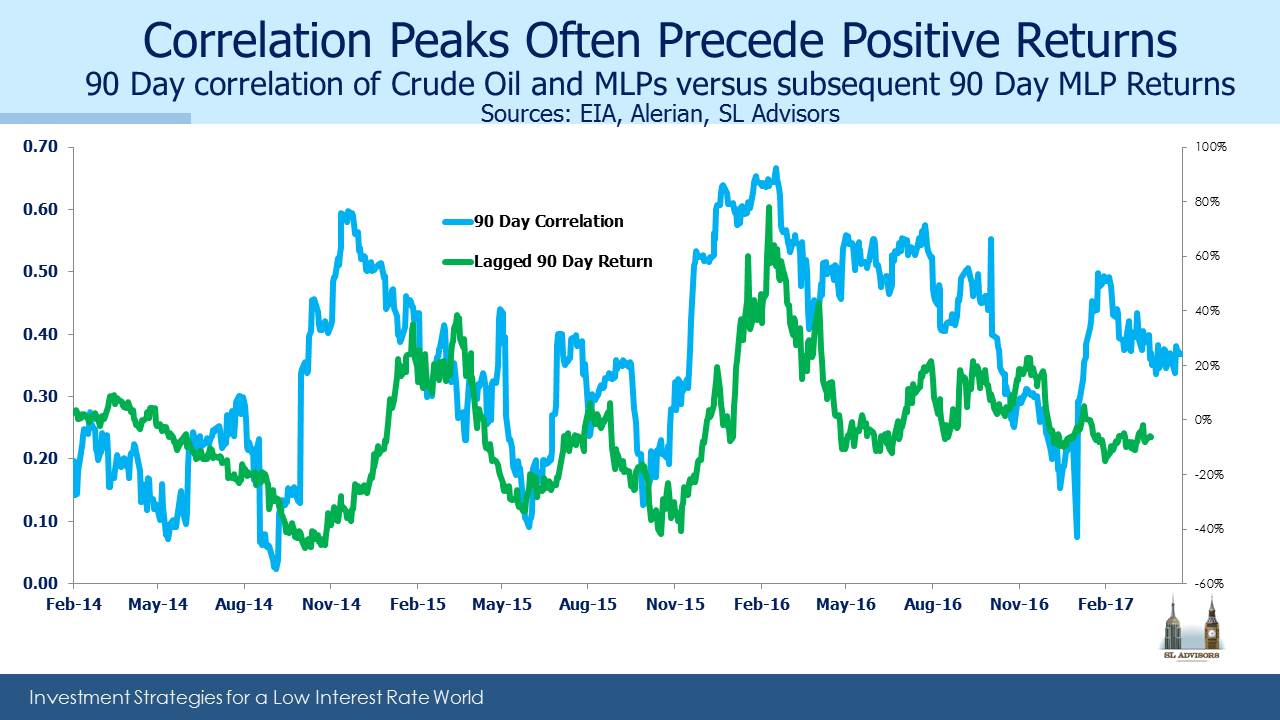
For those who enjoy analyzing statistical qualities of returns, the chart below compares the correlation of MLPs with crude oil and subsequent performance. It turns out that following periods of high MLP/crude correlation, MLPs do rather well. The 30 day correlation is 0.61, so the 90 day correlation used in the chart below is most assuredly heading higher over the next few weeks. A high 90 day correlation is typically followed by a good 90 day return. The correlation of this relationship is 0.63. It’s been said that if you torture the data enough it’ll tell you whatever you like, and some may believe that’s what’s going on here.

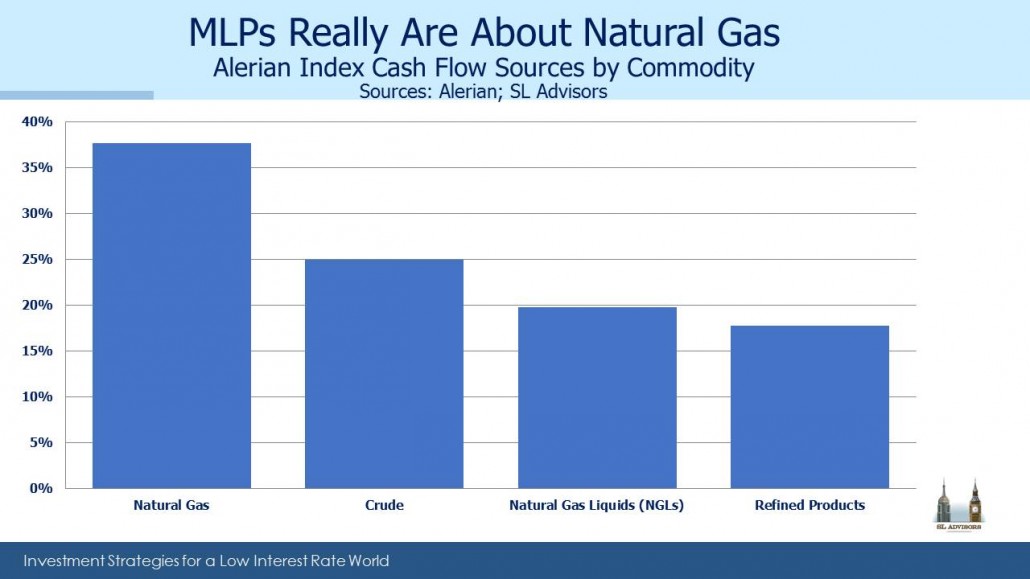
On the other hand, MLPs and crude oil shouldn’t move together nearly as much as they do, so when they dance too closely perhaps nervous sellers create an opportunity. In researching the components of the Alerian MLP Index, we calculate that only 25% of the cashflows are derived from crude oil. Some large MLPs have very little crude exposure, including Enterprise Products (EPD) at 17% and Williams Partners (WPZ) with 5%. Others such as Oneok Partners (OKS) and EQT Midstream (EQMP) have 0%. And this is the percentage of their cashflows derived from volumes of crude passing through their systems, which are only loosely affected by the price of crude. Natural Gas Liquids (mostly Ethane, Propane, Butane, Iso-butane and Pentane) are most commonly separated from the natural gas (Methane) with which they’re extracted. NGL prices tend to move with crude oil, but together these still represent less than half the cashflows of the Alerian index. As with crude, volumes are the principal driver of NGL-related cashflows, with their prices being of secondary importance. Nonetheless, MLP prices move with crude oil, reinforcing the understandable fixation MLP investors have with oil even though it’s hard to justify based on underlying fundamentals. In our fund we have an overweight to crude oil-oriented infrastructure businesses, but we estimate this at around 32%, so 7% higher than the index.

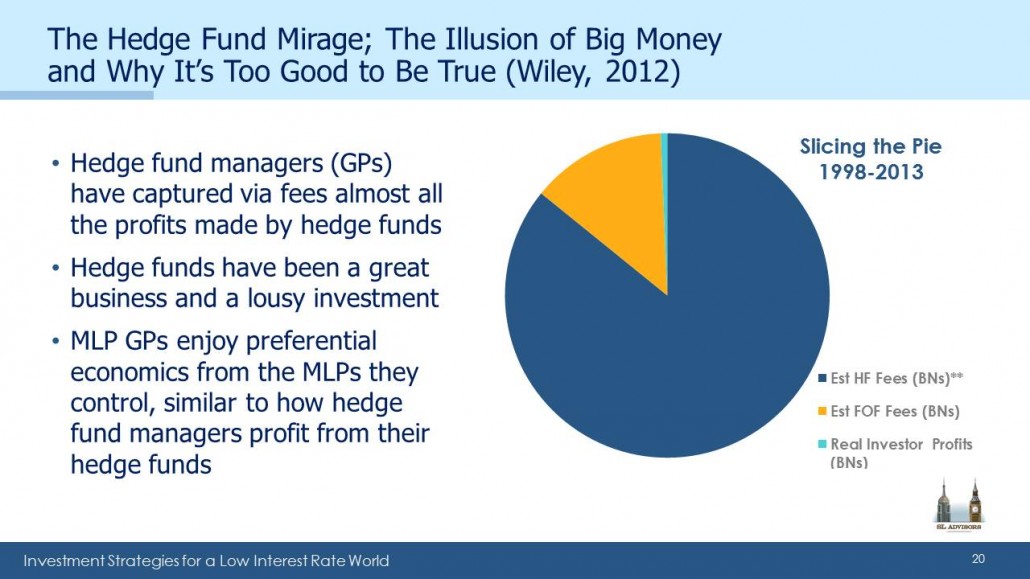
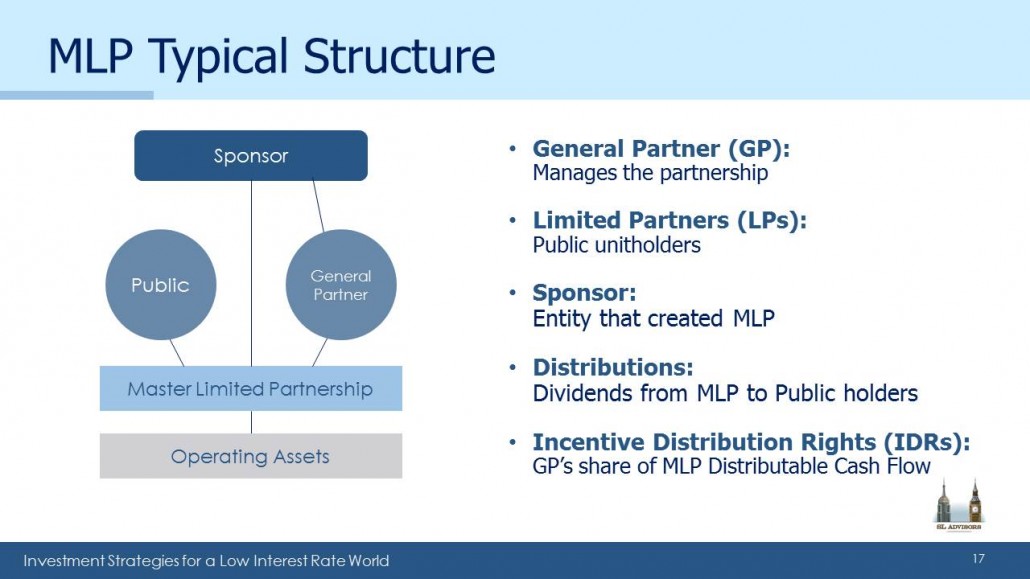
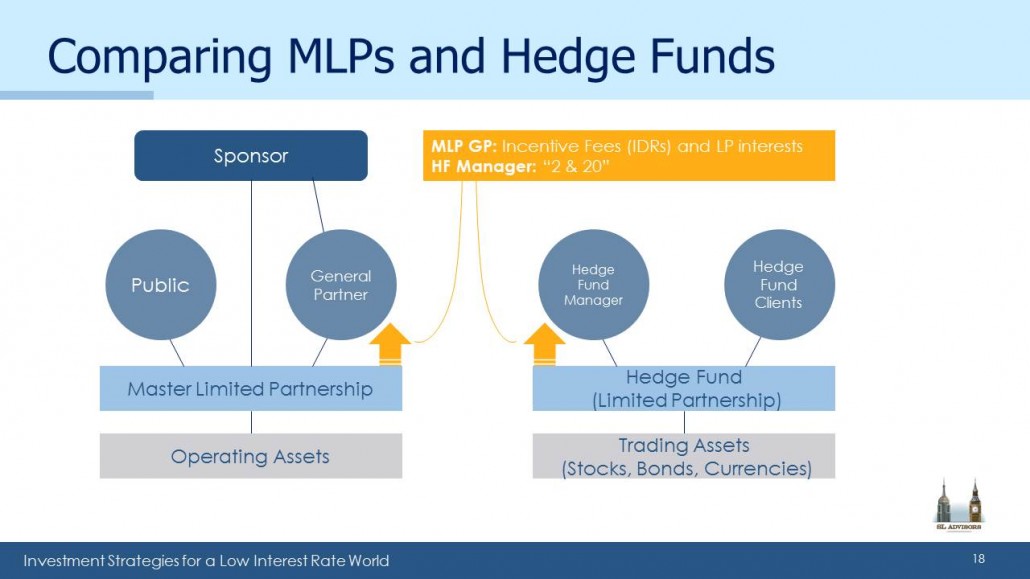
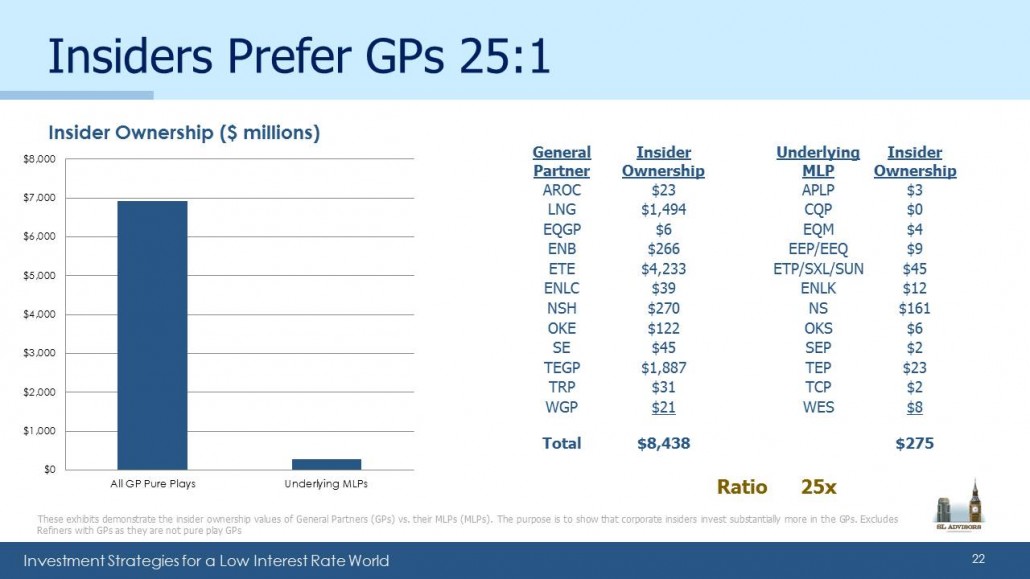
On another topic, last week we fielded a few questions from holders of Rice Midstream Partners (RMP). EQT recently acquired RMP’s General Partner (GP) Rice Energy (RICE). RMP slumped, because it highlighted a theme of our investing, which is that you don’t need to own an MLP to control it; owning the GP is sufficient. RMP investors have few rights, and the supply of accretive dropdowns they were expecting from their GP will now be redirected to EQM, a loss of future value over which RMP investors have little recourse. It’s why we invest in GPs (see MLPs and Hedge Funds Are More Alike Than You Think).

We are invested in EPD, EQGP (GP of EQM), Oneok (OKE, GP of OKS) and Williams Companies (WMB, GP of WPZ).

MLPs and Hedge Funds Are More Alike Than You Think

It usually pays to invest with management. In the hedge fund industry that has rarely been possible. Although most hedge fund managers invest in the fund they run, their wealth has come from owning the hedge fund General Partner (GP), which manages the fund. Opportunities to invest in hedge fund GPs are rare; they don’t need your capital and have little desire to share the lucrative economics.

In 2012 I wrote The Hedge Fund Mirage; The Illusion of Big Money and Why It’s Too Good To Be True. The book pointed out what most hedge fund managers know – that hedge funds have been a great business and a lousy investment. Fees have eaten up virtually all the investment profits. Money still flows to hedge funds, because there are and always will be some good ones. But the farther you stray from a unique, specialized strategy the more prosaic your returns. The book drew some nice reviews and provoked few critics, because most industry insiders preferred to minimize awareness of the lopsided split of investment returns. Being controversial turned out to be great fun, and caused us to think differently about another asset class.

Master Limited Partnerships (MLPs) look like hedge funds. Although they own actual infrastructure assets rather than stocks, bonds and currencies, they share their organization as partnerships with hedge funds and private equity. MLP investors, like Private Equity (PE) fund investors, have limited rights. They’re called “Limiteds”, because Limited Partners (LPs) have little recourse once they’re invested (see The Limited Rights of Some MLP Investors).

Not all MLPs have a GP, but many do and given how well hedge fund managers have done it’s no surprise that the people who run MLPs prefer to invest in the GP. The issue doesn’t receive much attention, but research we’ve done shows that in a select group of MLPs (i.e. those we care about) management has 25X as much money invested in GPs versus LPs.

Hedge funds and PE funds classically pay their GP “2 & 20”. This 2% management fee and 20% of the profits means, for example, that an 8% return after fees required a 12% return before fees. The 4% difference goes to the manager. MLPs pay their GPs Incentive Distribution Rights (IDRs), which direct a portion of the MLP’s Distributable Cash Flow (DCF) to the GP. The DCF split typically starts low but goes up to 50%, so the GP’s share can tend towards half.

The power of this becomes clear when you consider the financing of a new pipeline. GPs direct their MLPs to do something, the same way a PE manager directs his PE fund. A new pipeline is designed, planned, built and operated by an MLP on instructions from its GP, who then receives his share of the additional DCF created. Asset growth for PE managers is invariably beneficial, and it’s generally true as well for MLP GPs.

The best time to own hedge fund, PE or MLP GPs is during periods of asset growth. The Shale Revolution (see America Is Great!), with its growing output of crude oil, natural gas liquids and natural gas, is driving the need for more infrastructure assets. Recognition of this is behind the 25X statistic noted above.

It’s not a perfect analogy. For example, hedge fund investors have in aggregate done rather poorly, whereas 10 year MLP returns of 7.2% are better than REITs, Utilities and Bonds. Since MLP’s generally only raise equity from taxable U.S. investors tolerant of a K-1, they are limited to this relatively small portion of the global equity market. Those MLPs whose growth plans required several $BN have given up the lucrative GP/MLP structure in favor of being conventional corporations. But, as the 25X table shows, a decent number find the MLP structure still works.

At the MLPA Conference in Orlando a few weeks ago, questions usually concerned near term fluctuations in demand for one asset or another. We think the big trade here is America’s Path to Energy Independence, and owning GPs that benefit from continued infrastructure development. Conference chatter as well as attractive valuations show that it’s not yet a crowded trade.


Same Data, Different Conclusion

We’re not the first MLP investors to be puzzled by sector weakness in the face of growing oil and gas production. This was visible most clearly on Wednesday, when a sharp drop in crude following inventory numbers caused similar drops in many MLPs. Crude prices are weak precisely because of the success of technology in lowering costs, most obviously in the Permian in West Texas where most of the growth in output is occurring. Higher than expected U.S. production is mitigating the impact of OPEC’s production cuts. This ought to be bad for producers of conventional crude oil elsewhere in the world, and good for the owners of U.S. energy infrastructure handling greater volumes. So far, that hasn’t been the case.

Moreover, Permian-exposed Exploration and Production (E&P) companies are faring better than the MLPs that service them. This year MLPs with Permian exposure have lagged the Alerian Index. With rising output depressing prices, one might conclude that investors regard any increased utilization of infrastructure assets as temporary. Low crude will eventually feed through to reduced production and commensurately less need for pipeline and storage capacity. At odds with this view, the U.S. Energy Information Administration recently raised its 4Q18 forecast of output to 10.2 Million Barrels a Day (MMB/D), up from their 9.4MMB/D forecast of only four months earlier.

MLP investors may not believe this will happen. And yet, within the  E&P sector, those E&P companies with significant exposure to the Permian are outperforming the E&P index. Pioneer Resources (PXD) is outperforming all three MLPs we’ve highlighted, while Plains GP Holdings (PAGP) is underperforming all but one of the E&P names.

It seems that MLP investors and E&P investors are drawing sharply different conclusions from the same set of data on oil production. Or more precisely, potential MLP investors are declining to commit capital because they assess the outlook differently from E&P investors. At some point these views will have to reconcile, which we expect will result in higher MLP prices.

There’s a similar divergence with bonds. Since the low in the energy sector on February 11th last year, the High Yield E&P sector and MLPs have roughly kept pace with one another. Over the last few months they have diverged, with MLPs underperforming. Since E&P companies are generally MLP customers, it’s odd for the prospects of the customers to be improving without a positive knock-on effect for MLPs. But for now, that is what’s happening. The same data on output is supporting different conclusions by various investor types.


The 2017 MLPA Conference

Last week was the annual MLPA conference, in Orlando, Florida. It’s safe to say the guests at nearby Walt Disney World had a more carefree time than beleaguered MLP investors. One long-time attendee described the mood as “glum”, noting that energy sector investors had expected a more vigorous rebound.

Although the conference is organized around presentations by management teams in the Hyatt Regency’s cavernous ballrooms, the private meetings that take place on the periphery are far more valuable. It’s also nice to catch up with some familiar faces.

We had a full schedule of meetings with management teams, usually with just one or two other investors in attendance. The most pressing question for MLP investors of late is, if Exploration and Production (E&P)  companies (i.e. MLP customers) are continuing to increase production of oil and gas, why isn’t this good for MLP stock prices?

In fact the entire energy complex has had a terrible few months. MLPs are -2% YTD although the sector feels as if it’s been falling for months. Meanwhile, the Oil Services ETF (OIH) is -22%. U.S. crude output is 9.2 MMB/D (Million Barrels per Day) and is widely expected to reach 10 MMB/D next year by many observers, including OPEC. 1Q earnings for E&P names as well as for MLPs recently were generally good with positive guidance. The fundamentals remain encouraging . To paraphrase a typical question from a financial advisor invested in our mutual fund, “If you’re so smart, how come we’re losing money lately?”

When asked about recent stock price weakness, MLP executives were similarly puzzled. The good news is that they’re not spending much time worrying about it – following the 2015 Crash many steps were taken to reduce reliance on the fickle equity markets. Leverage is down and distribution coverage is up. Distributions have been held flat and in some cases cut in order to finance growth, while growth projects have been screened for higher returns. Generally, MLPs don’t have a pressing need for capital. While stock price weakness makes both management and investors poorer, it’s not being met by a desperate rush for capital to complete projects. And in some cases, such as Targa Resources (TRGP), equity capital even at lower prices was nonetheless attractive financing for their recently announced Natural Gas Liquids pipeline from the Permian Basin to North Texas.

In short, management teams usually exuded excitement about greater utilization of their existing infrastructure and growth plans. They dismissed the high recent correlation between MLPs and crude oil as a temporary phenomenon and not reflective of improving midstream fundamentals. For investors who rely on the market to confirm the wisdom of their recent decisions, it’s a time for patience while America’s journey to energy independence sends ever more hydrocarbons through our pipelines, processing units and storage facilities.

We enjoyed the discussion with Tallgrass Energy (TEP) CFO Gary Brauchle. We’ve followed TEP for a while (see Tallgrass Energy is the Right Kind of MLP). Four years ago their Rockies Express natural gas pipeline (REX) looked increasingly redundant as its west-east flow from the Rocky Mountains to Ohio faced growing competition from the Marcellus shale. TEP reversed the flow on the eastern end of this pipeline, and is looking at making the entire line two-way. Apparently our meeting was the same day as a bearish report from an obscure research analyst, but his criticisms must have lacked substance since nobody raised the subject.

The MLP investor base has changed in recent years. Pre-Shale, it was an income generating asset class with modest growth. The Shale Revolution created a substantially greater need for capital to fund growth, such that during 2010-13 MLPs were raising more in equity than they were paying out in distributions (see The 2015 MLP Crash; Why and What’s Next). The conversion of the investor base from income seeking to growth seeking was not smooth. One CEO estimated 75% turnover in his shareholders over two years.

Topics of discussion included the drop in attendance from last year, although the convention facility is so big it rarely seems crowded. There was some surprise at the pricing of Antero Midstream GP’s (AMGP) recent IPO, with a yield of 1%. Even with the 73% annual distribution growth forecast by one underwriter, by 2020 it would still yield just over 5%. They may pull it off, but sharing some of that execution risk with an eager set of IPO investors seems like a smart move.

Those who had seen the presentation from the IPO roadshow chuckled at the inclusion of SnapChat as a comparable (because of its very high cashflow growth). We thought that, along with the pricing, betrayed a fairly demeaning view of investors by management. It seems most things need to go right for AMGP, and a stumble will expose the gulf in valuation between AMGP and, say, Plains All American (PAGP) with its 10% Distributable Cash Flow (DCF) yield. If MLPs were in a bubble, AMGP would be Exhibit 1, except they’re not.

In chatting about Energy Transfer, several investors remembered last year’s self-dealing transaction in which Energy Transfer Equity (ETE) issued preferential securities just to the management team (see Is Energy Transfer Quietly Fleecing its Investors?). It’s still possible a Delaware court could rule against ETE and order the transaction be cancelled.

In many of the meetings managements were peppered with very granular questions about percentage utilization of a particular asset next quarter. These generally came from sell-side analysts looking to refine their models so as to forecast the next quarter’s earnings and DCF. No doubt these are important topics, but we feel such “forest for the trees” questions miss the big picture. America is heading to Energy Independence, and midstream infrastructure is vital to that goal. In the near term, it might seem important to try and forecast a quarterly fluctuation, but it’s very hard to do so consistently.

Far more importantly, over the next few years what other asset class can possibly compete when America is headed towards being the world’s biggest crude oil producer (see America Is Great!)? Last November OPEC lost, and consequently our E&P companies are gaining market share. The short-cycle projects that are Shale represent a completely different risk paradigm to conventional drilling with its inherent uncertainty over returns (see Why Shale Upends Conventional Thinking). Gathering and Processing networks with their close exposure to the wellhead are more exposed to volume uncertainty in the short term, but over the longer term they’ll be utilized. These are the issues that will drive returns, and while most investors are probably aware of the big picture their questions often betrayed a blinkered view.

MLP management teams hold substantially more money in GPs compared with MLPs when given the choice within the GP/MLP structure. What could be a more powerful statement about the upside they see than their personal investment in the vehicles with operating leverage? The managements of Energy Transfer Equity (ETE) and TEP are communicating their opinions with their commitments of personal capital (see table at the end of The Limited Rights of Some MLP Investors).

In discussing their allocation to MLPs, I often ask investors what is the next most attractive sector of the equity markets beyond energy infrastructure, with its huge tailwinds, substantial future growth and 7% yields selling at 30% off its 2014 all-time highs. It doesn’t require much thought to buy what’s rising, but not much else is cheap.

In summary, value-seeking investors should draw comfort from the complete absence of irrational exuberance at this year’s MLPA conference. Today’s MLP investors are for the most part a patient bunch.

We are invested in ETE PAGP, TEGP (the GP of TEP) and TRGP

image_pdfimage_print