Recently in A Few Thoughts on Long Term Energy Use we included the striking chart shown again below comparing CO2 emissions from power generation in the U.S. and Germany. It elicited quite a few comments from readers because it showed that Germany is now lagging behind the U.S. on this metric. Germany has set out to be a global leader in the use of renewables. By 2050 they aim to generate 80% of their electricity from renewables and to cut their greenhouse gas emissions by up to 95%. Until 2015, Germany had the world’s largest installed solar capacity, which reflects quite a commitment because there are plenty of sunnier places on the planet than northern Europe. The push to renewables (dubbed “Energiewende”, or Energy Transition, in German) enjoys widespread public support, which extends as far as surcharges on household electricity. German consumers pay among the highest prices for electricity in the world, largely due to taxes and other charges in support of renewables.
By contrast, the U.S. has a more ambivalent view. Strong opinions are not hard to find on both sides of the debate over whether global warming is man-made. Some states, notably California, have implemented policies to reduce emissions as they became frustrated with inaction by the U.S. Congress. President Obama sought to impose stricter regulation on emissions through executive actions, but President Trump has said the U.S. will withdraw from the Paris Agreement on Climate Change. American public opinion doesn’t reflect the same concern about the issue as Germany. And yet, measured by CO2 output per unit of electricity, we’re doing better. Lower U.S. emissions come with cheaper electricity which stimulates economic growth.
The Shale revolution is certainly part of the reason. Abundant, cheap, clean-burning natural gas has been steadily replacing dirtier coal as the fuel of choice for power plants. In October (the most recent figures available) 33% of U.S. electricity produced came from natural gas, about 1% ahead of coal. Renewables were 15%, of which hydroelectric is just over a third. The rivers and waterfalls whose flows can be harnessed have long been identified, so don’t expect hydro to grow much. Solar and wind were 7.5%, up from 5.9% a year ago. Germany’s solar and wind contributed 18.2% of their power generation, although by consumption it was less because they export some of this clean electricity (see below).
Germany’s Energiewende faces two problems. The first is common to solar and wind everywhere – it’s not always sunny and windy. Since it’s still not currently possible to store large amounts of electricity cheaply for later use, conventionally powered baseload electricity capacity is required. Germany’s shutting down many of their nuclear reactors following Japan’s 2011 Fukushima disaster increased their reliance on coal to ensure a certain minimum amount of electricity is available. Around 12% of Germany’s electricity is generated by natural gas, and while it might make sense to increase this, Russia is their biggest supplier. Greater reliance on Russia’s Gazprom would synchronize disruptive pipeline maintenance with periods of policy disagreement between the two countries.
Their second problem is that wind power comes from the northern part of the country and Baltic Sea, while it’s needed in the south. Today’s north-south transmission capability is inadequate to move what’s generated.
A further unexpected consequence of the move to renewables has been distortions in Germany’s electricity market. At times the operators of windfarms have been paid to stop electricity generation since the spot price has gone negative. At other times Germany has exported cheap electricity to neighboring countries such as Poland, Czech Republic and Austria, which some claim has impeded those countries’ ability to develop local renewable energy sources.
The German government has taken steps to moderate near term growth of renewable capacity while the transmission network is brought into better alignment with output. None of the problems Germany is facing seem insurmountable over the long term, and America’s relatively greener credentials will probably be challenged. But given the political support for current policies in Germany, it’s notable how challenging they’re finding it to execute successfully.
https://sl-advisors.com/wp-content/uploads/2013/04/logo1.jpg00Simon Lackhttps://sl-advisors.com/wp-content/uploads/2013/04/logo1.jpgSimon Lack2017-01-29 07:00:032018-08-20 20:20:22It’s Not Easy Being Green
In our recent blog post America Is Great!, we described the success of America’s shale producers in the face of OPEC’s intention back in 2014 to bankrupt them with lower oil prices. The recent agreement on reductions in output was a concession that this strategy had failed (see OPEC Blinks). America’s private sector had bested countries representing more than a third of global oil production.
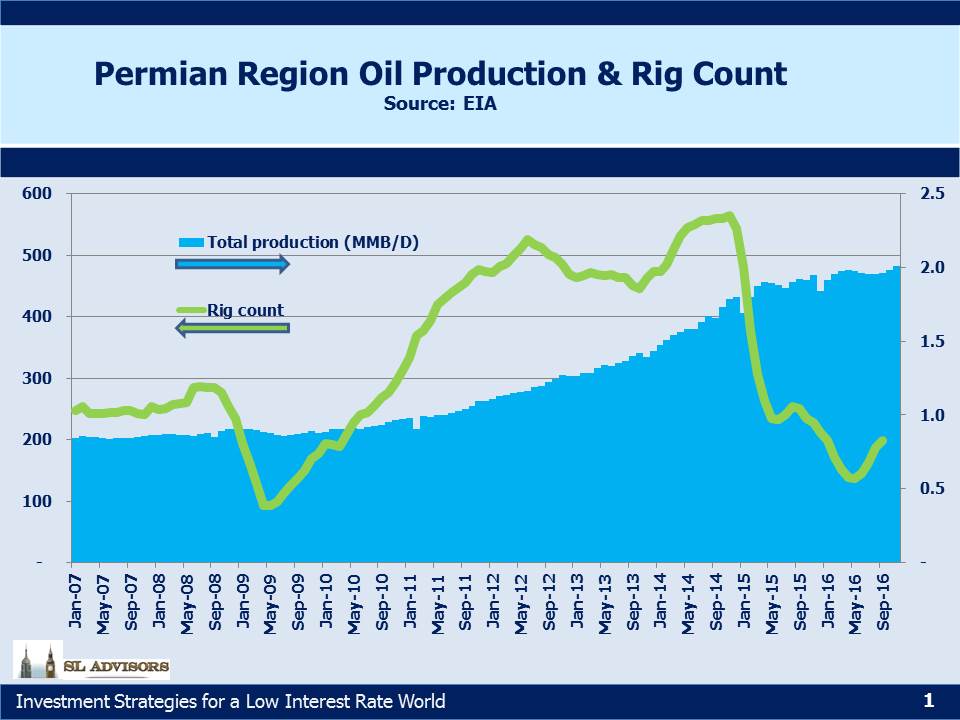
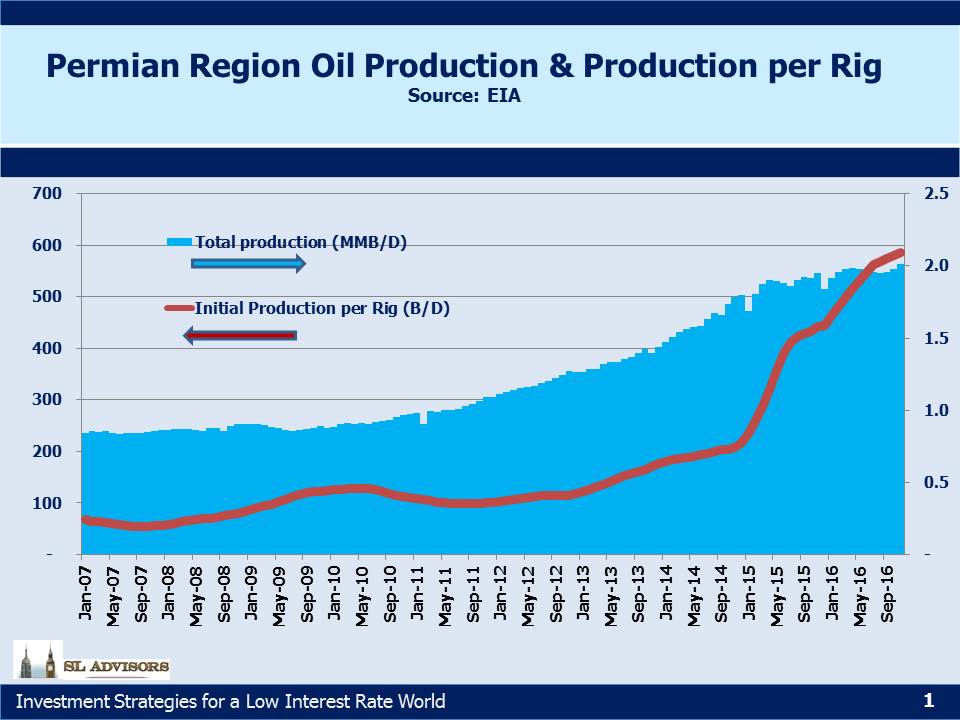
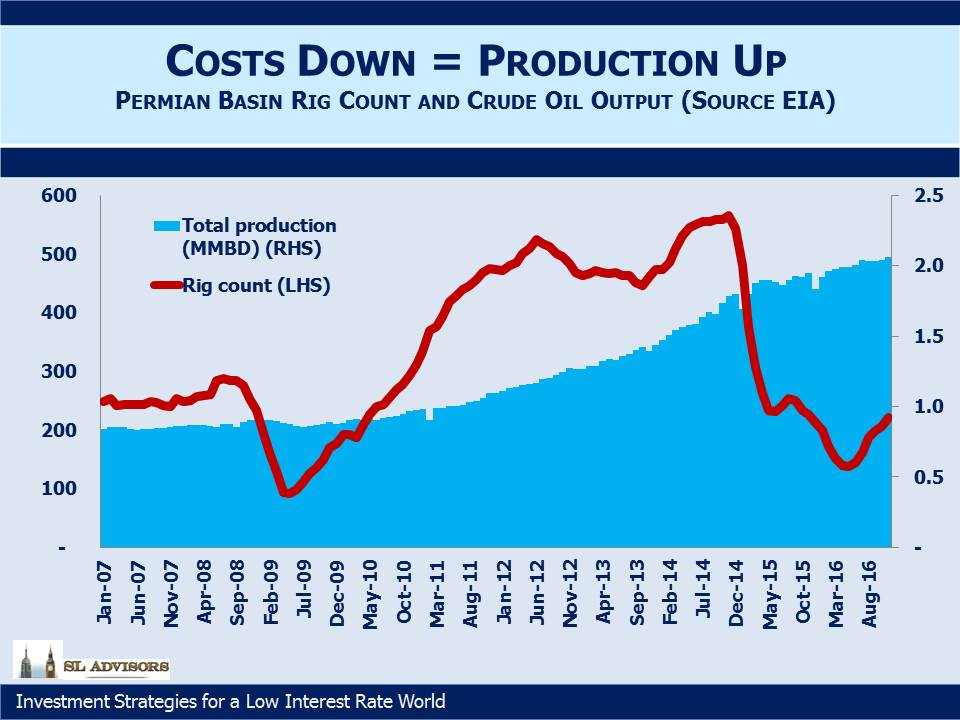
The Permian Basin in West Texas represents this success more clearly than just about any other region in the U.S. It chiefly consists of two areas, the Delaware Basin and the Midland Basin, with several plays within each region. The Permian has been a source of crude oil production in the U.S. for decades. The first commercial oil well was completed there in 1921. As the Shale Revolution took hold over the last ten years, Permian output rose along with other plays. But such is the opportunity, combined with continued technological improvements in drilling, that output barely dipped in 2015 even while other shale regions saw cutbacks. Today, almost half the active drilling rigs in the U.S. are in the Permian Basin. This is driven by the productivity of Permian wells, where production from new wells has more than tripled over the past three years.
The Energy Information Administration’s (EIA) recent Annual Energy Outlook 2017 forecasts Permian crude production to increase by around 40% over the next five years based on current futures prices. If crude oil trends higher, the Permian holds the potential for significantly greater output than that.
The irony of this is not lost on an investor in Master Limited Partnerships (MLPs). We were originally led to expect stable income that grew steadily each year. The Shale Revolution added excitement and substantial upside to this originally rather pedestrian story, but also exposed the frailty of the more recent investor base. The bear market of 2015 was so clearly a problem of MLPs confronting growth opportunities whose capex needs exceeded their current cashflow (see The 2015 Crash; Why and What’s Next).
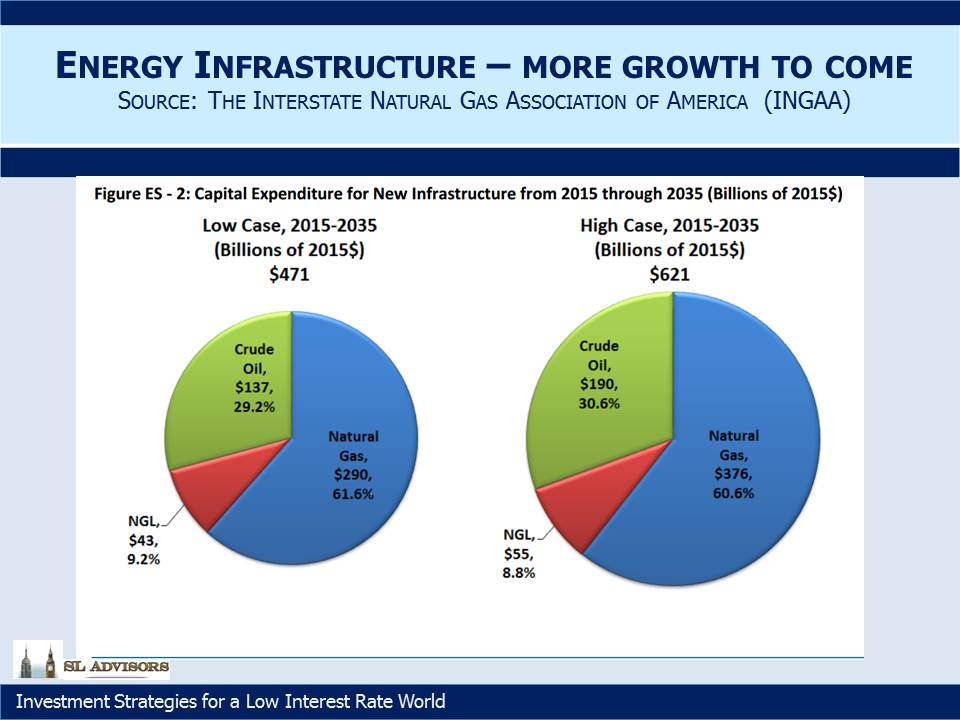
The collapse in MLP prices led energy infrastructure businesses to achieve greater alignment between their funding and investment opportunities. Energy Independence, never previously attainable, came into view as a realistic goal within less than a generation. Adapting our existing energy infrastructure network to support this vision is creating substantial opportunities for today’s leaders. Being an MLP investor today inevitably requires studying the markets for oil, Natural Gas Liquids (NGLs) and natural gas. Sales made by investors in late 2015/early 2016 will rank up there among the biggest missed opportunities of all time.
The Permian is now the target of a veritable land rush as some of the world’s biggest oil companies seek to increase their presence. Exxon Mobil (XOM) just agreed to pay $6.6BN for 275,000 acres. Noble Energy bought acreage for $2.7BN. The region has seen over $25BN in acquisition activity since June.
Memories of the global glut caused by North American production are still fresh. Now that U.S. production is increasing again, there are fears of a repeat. The world needs 6 million barrels a day of new supply each year to replace depletion from existing wells and new demand. We don’t think a second collapse is likely, but in any event U.S. shale producers have shown that they’re better able to withstand such an outcome than others. Meanwhile, in China for example, oil output has entered long term decline, creating one new source of extra demand for imports.
Growing Permian output will use up some of the extra take-away capacity, including for Plains All American (PAGP) who estimate they could see up to $600M in increased EBITDA as output grows.
We are invested in PAGP
https://sl-advisors.com/wp-content/uploads/2013/04/logo1.jpg00Simon Lackhttps://sl-advisors.com/wp-content/uploads/2013/04/logo1.jpgSimon Lack2017-01-22 07:00:542018-05-03 17:33:38West Texas Leads a New Oil Boom
With only the slightest risk of hyperbole, I can assert that anything written by Michael Lewis is worth reading. His latest work, The Undoing Project, recounts the friendship between two Israeli psychologists which led to Daniel Kahneman’s Thinking Fast and Slow. Kahneman, with his late friend Amos Tversky, developed an area of Behavioral Economics which shows why so much economic theory fails in practice – because humans inconveniently act like humans and not the economic agents (“econs” in Kahneman’s book) economists assume. Both books are highly readable.
I was reminded of this by Williams Companies’ (WMB) ill-considered secondary offering announced late on Monday. Last August, WMB and its MLP, Williams Partners (WPZ) were pondering how they would finance their capex budget. The Shale Revolution has led to many opportunities for WMB to add on to its Transco natural gas pipeline network, an irreplaceable artery running down the eastern United States. The price of WPZ reflected this uncertainty through a 9.7% yield. So WMB did something rather clever; they cut their distribution with the intention of using the cash saved to invest in WPZ. Removing the financing uncertainty drove both stocks higher. WPZ’s distribution was now secure, its financing assured and WMB shareholders (who are total return oriented rather than fixated on dividends) cheered the redirection of some WMB cash into cheap WPZ units. We wrote about this in Williams Satisfies Two Masters.
To return to Michael Lewis, he recounts how Amos Tversky came to believe that humans underestimate how random life is. He showed how events that appeared inevitable after the fact were very often assigned extremely low probabilities prior. Thus is it that last Summer’s moves by WMB appeared to be the reliably sensible choice you’d expect from an insightful management team. Whereas in fact the partial reversal of the August moves by WMB last week confirm that intelligent moves don’t necessarily confirm intelligence by the protagonists, but can in fact be dumb luck.
The two press releases reflect an Orwellian quality. Last August the goal was to ensure WPZ’s distribution was stable and WMB’s dividend was sacrificed to this end. Confusingly, today WPZ’s distribution is no longer regarded as important, while WMB’s is now raised. The solemn language about positioning for long term growth appears in both press releases even while in concert they reflect not a coherent strategy but a staggering from one transaction to another based on the last piece of advice received. WMB doesn’t seem to know if it needs cash or not — on the one hand it’s raising $2BN in equity, but on the other it’s increasing its payout.
More disappointing than their flip-flopping on dividends was the elimination of the Incentive Distribution Rights (IDRs) received by WMB from WPZ. IDRs are the payments the GP receives for running their MLP. WMB gave up its future claim to IDRs, which based on their 3Q16 receipt amounts to $900MM in annual cashflow. In exchange, they received 289MM WPZ units which, based on the new reduced dividend will generate only $694MM in cashflow. Moreover, IDR cashflows are worth a much bigger multiple than LP cashflows because they grow faster. Pure GPs trade at 2X the multiple of MLPs, and this was one of the attractive features of owning WMB. A fair consideration for the foregone IDRs would have been substantially more than the number of WPZ units actually received, which is why WMB shares fell 10% when the moves were announced. If WMB management was surprised at the market’s reaction, they’re either dim or incompetent.
WMB’s management has shown that they never really understood how intelligent they’d been in August when they redirected some of WMB’s cashflows away from dividends and towards WPZ. There wasn’t anything obviously wrong with this plan; it didn’t require tinkering. Their moves are random. There is no strategy, just a series of unrelated moves. Tversky showed Israeli Air Force instructors that the harsh feedback they gave trainees following errors wasn’t, in fact, causing subsequent improvement. Rather, pilots’ performance varies, and regression to the mean caused bad decisions to be followed by good ones regardless of the feedback from instructors. The management at WMB is similarly showing that they’re no better than average at corporate finance.
As usual, their advisers are the smartest guys in the room, finding new ways to shuffle the deck while generating fees. If you’re an equity underwriter, every client looks as if they’d benefit from more equity capital. This is no doubt the type of muddle-headed thinking that has caused Keith Meister, one-time WMB board member, vocal critic and head of Corvex Capital, so much frustration. WMB controls great assets – unfortunately the management isn’t of the same quality.
We are invested in WMB.
https://sl-advisors.com/wp-content/uploads/2013/04/logo1.jpg00Simon Lackhttps://sl-advisors.com/wp-content/uploads/2013/04/logo1.jpgSimon Lack2017-01-15 07:00:132018-05-03 17:33:38Williams Loses Its Way
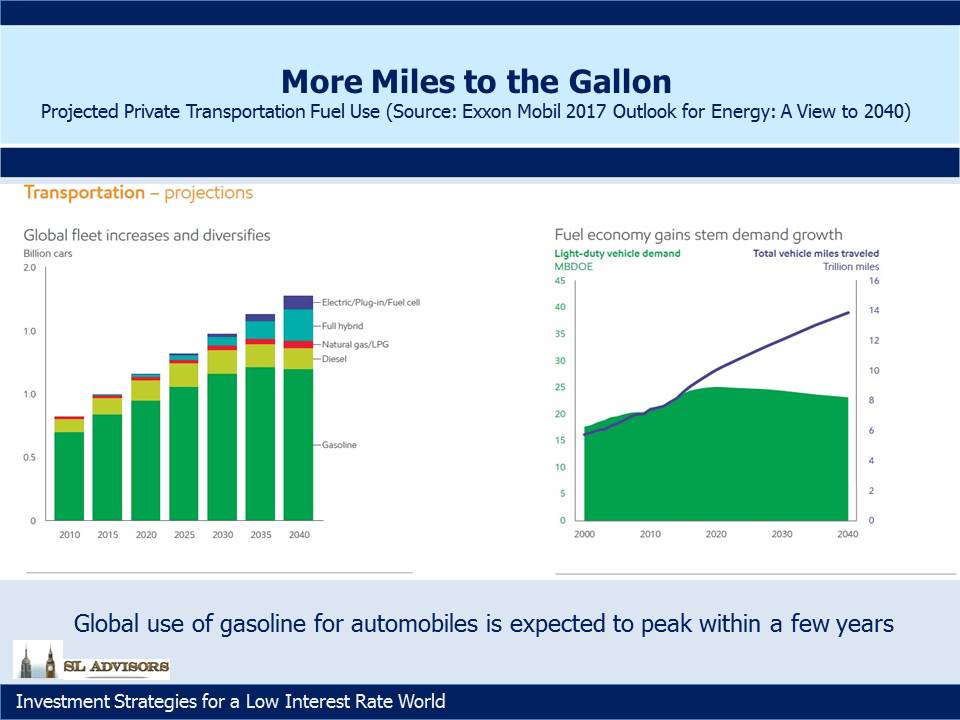
Every year Exxon Mobil publishes their outlook for global energy over the next 25 years. It’s an absorbing read for people who care about such things. Their projections may not all be right, but they have to think about such issues pretty carefully and make long term investment decision based in part on their views. In reading the latest edition: 2017 Outlook for Energy: A View to 2040, a few slides jumped out.
The U.S. Energy Information Agency (EIA) also just published their 2017 Annual Energy Outlook which includes projections out to 2040. Although these two reports are structured differently (Global versus U.S.; Exxon makes single case forecasts whereas EIA includes multiple scenarios) they are generally consistent. They agree on broad issues such as improving energy efficiency, more U.S. consumption of natural gas for electric power and industrial use, and gradually increasing crude oil production. The EIA forecasts the U.S. to be a net energy exporter within 5-10 years (depending on scenario), driven by sharply higher natural gas production displacing imports and leading to a net export position, and somewhat higher crude oil output reducing but not eliminating oil imports.
Although the world will drive more cars and many more miles thanks to demand in Asia, gasoline use for private automobiles is expected to peak within just a few years. Increasing use of electric and hybrid cars along with continued improvements in conventional engine fuel efficiency will more than offset more driving. China for example just announced plans to invest almost $400BN in renewable fuels by 2020. Although this is directed at reducing pollution from power generation, to the extent hybrid and electric cars gain market share in China they will use cleaner electricity. Based on today’s heavy reliance on coal for generating electricity, Chinese Tesla drivers have little to brag about. It’s also worth noting that the EIA in its Reference Case forecasts continued growth in U.S. exports of petroleum. This isn’t necessarily at odds with Exxon’s forecast of flat global gasoline use if U.S. refiners gain market share.
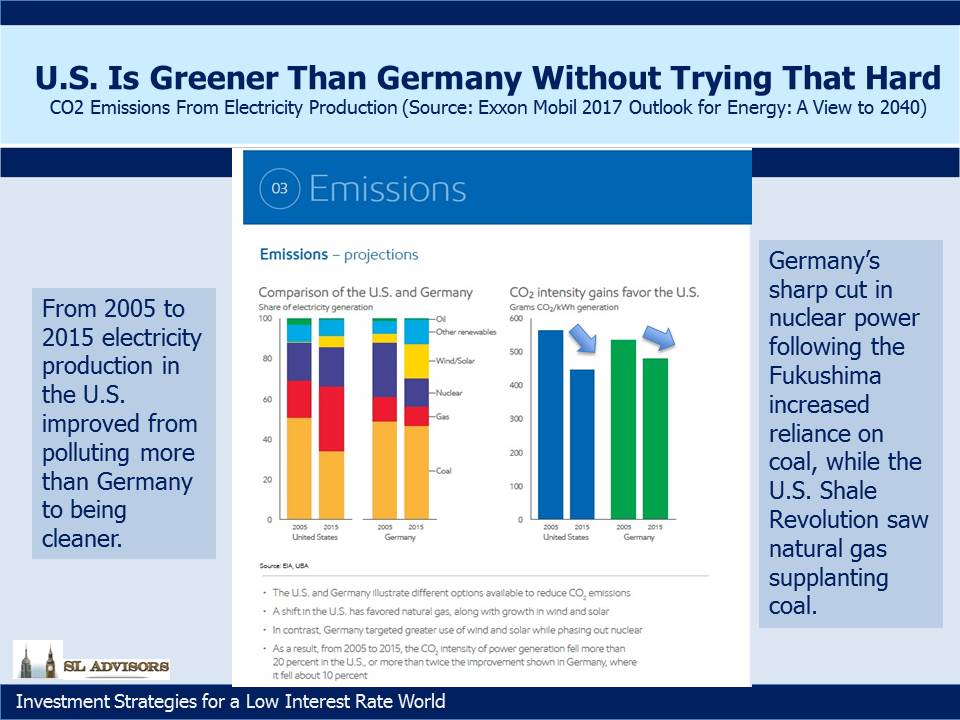
Germany has become a pioneer in the use of windpower, aided by many flat areas on which to build windmills as well as the very windy Baltic and North Seas. Germany sees itself as a leader in the use of renewable energy, a responsible global citizen limiting its contribution to global warming. And yet, few probably realize that the U.S. now generates electricity with less CO2 output than Germany. The improvement in the U.S. is due in large part to greater burning of natural gas instead of coal for electricity generation, a consequence of the Shale Revolution. Meanwhile, Germany’s green efforts have been harmed by its sharp reduction in nuclear power following the near meltdown of Japan’s Fukushima reactor in 2011. Renewables can only do so much, and as a result Germany’s use of coal has stayed higher than it might otherwise. Germans may not feel they need a lecture from Americans about saving the planet, but America can demonstrate better results.
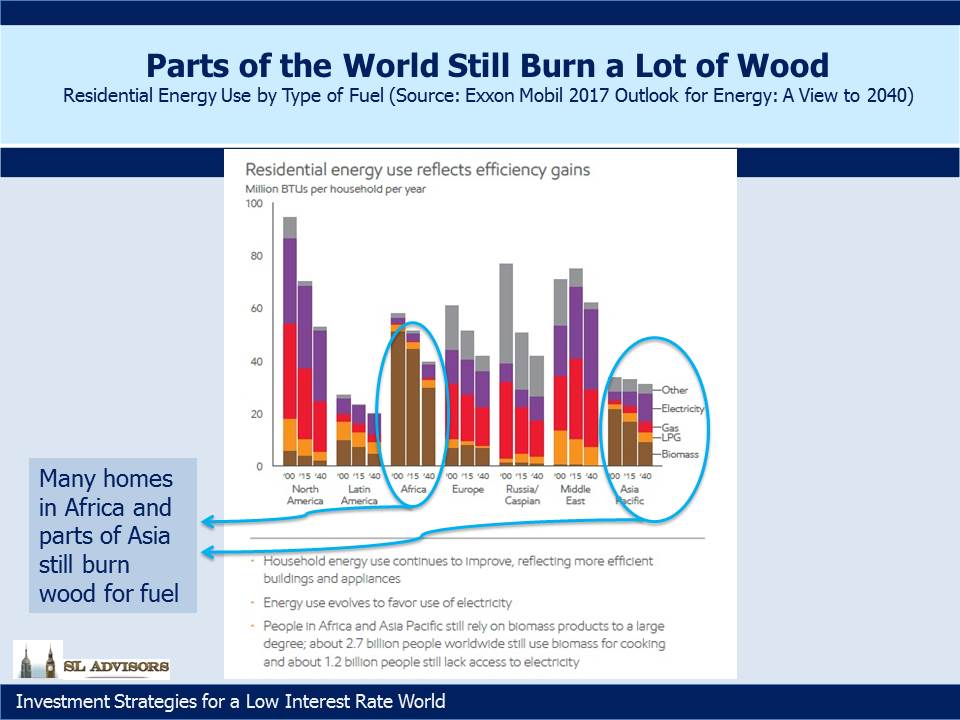
The third slide highlights the highly undeveloped use of energy in homes across Africa and parts of Asia. Biomass (wood, in different forms) may be renewable but it’s not especially clean burning for those in its immediate vicinity. A complete assessment of its environmental impact is complex and depends on how it’s harvested, the climate, what type of wood and the available alternatives. We just found it surprising to see how much of the world still relies on a relatively primitive source of energy.
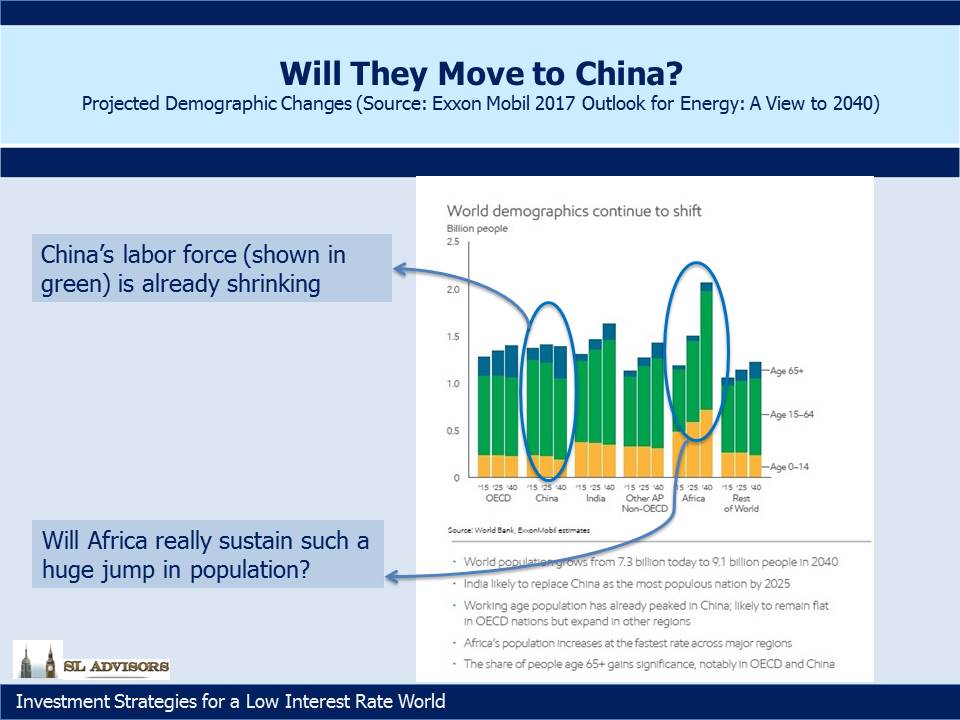
Finally, although demographics shift slowly, they’re still worth a look from time to time. China’s working age population is peaking around now. Since GDP growth comes from only three sources: (1) Labor force growth, (2) Productivity improvements and (3) Capital, Chinese GDP growth will need to come fully from the latter two now on. Developed economies are reckoned to be capable of 1-2% annual GDP growth before adding in the effect of labor force changes. Few are forecasting that China’s GDP growth will sink to this level, but it’s an interesting thought that ALL their growth will have to come from doing things better than before.
Meanwhile, Africa is forecast to add twice the population of North America in about a generation. Providing food, employment, housing and infrastructure for so many people is a challenge no region of the world has faced before.
https://sl-advisors.com/wp-content/uploads/2013/04/logo1.jpg00Simon Lackhttps://sl-advisors.com/wp-content/uploads/2013/04/logo1.jpgSimon Lack2017-01-08 07:00:202018-05-03 17:33:38A Few Thoughts on Long Term Energy Use
Back in 2014 they were unlikely adversaries. Saudi Energy Minister Ali Al-Naimi, and Pioneer Natural Resources (PXD) CEO Scott Sheffield (pictured below) had both made their careers in the oil business. They had each spent formative years abroad, with Al-Naimi attending Lehigh University and Sheffield going to high school in Iran (his father worked for Atlantic Richfield). Both were dedicated to maximizing the value of the fossil fuels they controlled, and had hunted together (a common pastime for oilmen).
But the success of horizontal drilling and hydraulic fracturing (“fracking”) in the U.S. was releasing increasing amounts of crude oil from hitherto impenetrable porous rock. A consequence was that from 2011-2014 fully all of the increase in global demand for crude oil had been met by North American production (see Listen to What The Oil Price is Saying). This was hurting prices and reducing OPEC’s market share. Al-Naimi concluded that the interlopers were vulnerable to a drop in prices that would expose their high cost structure. Pioneer was one of the biggest producers of shale oil. They had been deemed “The Motherfracker” by hedge fund manager David Einhorn who likened their low return on capital to, “…using $50 bills to counterfeit $20s.” Scott Sheffield’s business and others like it were increasingly at odds with OPEC, and Al-Naimi decided they needed to be stopped.
So it was that in late 2014 the Saudis shocked the oil market by promising to increase production into an already oversupplied market, rather than adopt their familiar role of swing producer, modifying their own output to smooth price swings. They calculated that lower prices would bankrupt large swathes of the U.S. shale oil industry, eventually cutting production and allowing prices to return to the $100+ levels necessary to support Saudi Arabia’s budget. “We are going to continue to produce what we are producing, we are going to continue to welcome additional production if customers come and ask for it,” al-Naimi said.
What followed over the next two years is one of the most extraordinary stories of private sector innovation in the biggest, most dynamic economy the world has ever seen. Crude prices plummeted, falling as low as $26 a barrel on February 11th, 2016. Facing an existential threat to their businesses, Pioneer and many companies like it drove production costs down relentlessly, bringing break-evens down to levels few had thought possible.
This is most obvious in metrics such as the rig count, whose 75% fall led to only a relatively modest drop in production as the best rigs were employed for shorter periods at lower rates. Moreover, individual well productivity improved as longer laterals focused on sweet spots increased output. The composition of proppant was refined. Sand keeps the cracks open that fracking creates, and finer grains in greater volumes further increased output. Service providers were squeezed to reduce their costs and idle less efficient equipment. The industry staggered for a while under the body blow of lower prices, and many overleveraged companies failed. But overall it stayed on its feet, adapted to the new world and maintained oil production at levels substantially higher than prior to the Shale Revolution.
Although prices bounced from $26, they remained persistently lower than many OPEC countries (including most notably Saudi Arabia) needed to balance their budgets. In 2015 the Saudis ran a deficit equal to 15% of GDP and resorted to issuing bonds to fund expenses. Sharp spending cuts followed. Drilling budgets around the world were slashed, and an estimated $1TN was cut from planned capex out to 2020. As the failure of Al-Naimi’s strategy became apparent, he was replaced in May of 2016. The Saudis still plan to sell shares in their giant oil company Saudi Aramco, so in choosing its chief, Khalid Al-Falih, as their next Oil Minister, they picked someone acutely sensitive to the need for a higher price.
OPEC’s recently announced production cutbacks, whether or not they are in fact implemented, are an admission of defeat. As many of the world’s biggest oil producers gathered in Vienna to plot global output and prices, the biggest disruptor was absent. America has no view on global oil production. Crude oil prices remain around half of their highest levels in 2014. Scott Sheffield heads into retirement with PXD’s stock close again to its all-time high, and claims to have production costs as low as $2 per barrel for Permian Horizontal wells.
Shale oil and gas production are upending the energy markets. The U.S. is not just the leader in this new technology, it’s virtually the only game in town. Oil, natural gas liquids and natural gas are known to exist in porous rock all over the world, notably in China and Argentina. America’s dominant position reflects many inherent free market advantages in the world’s biggest economy which are not sufficiently present elsewhere.
Start with a large energy sector already adept at exploiting conventional resources, with a deep pool of skilled labor and long history of technological improvement. Add to this: access to capital from the world’s biggest capital market; a strong entrepreneurial culture; existing energy infrastructure that can be modified and enhanced to service these new regions of output; ample water and specific grade sand supplies (needed for fracking), often conveniently located; mineral rights that belong to property owners, unknown in other countries but taken for granted in the U.S., which builds community acceptance of drilling activity that creates local wealth.
Natural gas from U.S. shale was developed under a much higher price regime which allowed time for scale that could lower costs as global Liquified Natural Gas supplies weighed on prices. Similarly, the development of crude oil sourced from shale started when prices were higher, so the industry was subsequently mature enough to adapt to falling prices. Horizontal drilling and hydraulic fracturing of rock could not have developed as they did under today’s hydrocarbon price regime. OPEC’s strategy was correct but several years too late. There is no going back.
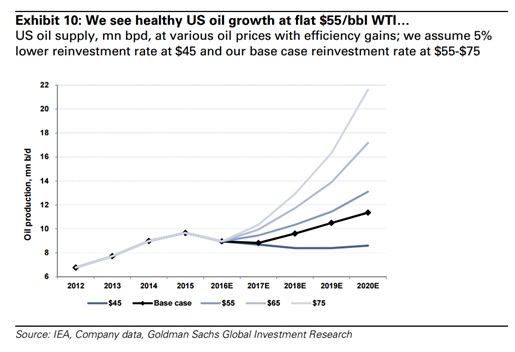
Only the U.S. combines all these advantages. The result is that cheap natural gas now produces more electricity than coal, and in November for the first time we became a net exporter of natural gas. We’ve even shipped it to the United Arab Emirates (see Coals to Newcastle), because it’s cheap enough to cover the transportation costs. Crude oil production has turned back up, and the Permian Basin in west Texas (Pioneer’s main area of production) may lead the U.S. to being the world’s biggest oil producer, with both Goldman Sachs and JPMorgan forecasting meaningful increases in output over the next five years at current prices. The world needs U.S. supply. Global consumption is currently around 95MMBD (Million Barrels Per Day). Existing plays suffer annual depletion of around 5% (around 5 MMBD) and new demand is another 1-1.5MMBD. So 6-6.5MMBD of new supply is needed, and the $1TN of capex reductions noted earlier mean it will be coming from fewer places.
Bear in mind that this all happened with an Administration regarded as hostile to domestic production of fossil fuels, at least by the senior executives in that industry. The strong growth in production during Obama’s eight years in office either disproves this view or demonstrates resilience in spite of it. Nonetheless, it’s hard to imagine a more supportive scenario than the one presented by the incoming Administration. Kelcy Warren, Energy Transfer Equity (ETE) CEO, can’t wait for Trump to lift the remaining obstacles to completion of the $3.6BN Dakota Access Pipeline, held up by protests and a late White House intervention in the permitting process.
Connections with the energy industry are conspicuous among Trump’s early cabinet picks. Former Texas governor Rick Perry is a director of Energy Transfer Partners (ETP), a position he will no doubt relinquish as he heads up the Department of Energy. As a presidential candidate four years ago Perry planned to close the department. It was one of three Federal agencies he planned to close, and in a delicious twist was the one he famously forgot during a debate (his “Oops” moment). As its head, once he finds his way there he will presumably exercise a light touch in overseeing the energy sector. America’s foreign policy will be led by Exxon Mobil (XOM) CEO Rex Tillerson. After these and other cabinet picks are approved by the Senate, the shift in public policy at the Federal level in support of domestic energy could be dramatic.
Moreover, in crude oil the U.S. is now the global swing producer. To see why, consider the thinking behind the $1TN in cuts to exploration budgets (see Why Oil Could Be Higher for Longer). Conventional oil projects involve a large up front capital commitment with a long payback period, during which the overall profitability will be exposed to oil prices. Since the futures market only offers liquidity out to 2-3 years, oil drillers are basically long the oil market.
Assessing this risk now includes the 2014-16 oil price collapse which damaged the IRR on many prior investments. A previously uncontemplated oil price is preventing many new projects from being funded, because it might repeat. Yet the U.S. shale producer, ostensibly the instigator of the excess supply, pursues many small projects with minor upfront expense (a horizontal well now costs on average less than $5MM) mitigating individual risk. U.S frackers may forego the significant cost of completing a drilled well in response to lower prices, resulting in an inventory of DUCs (Drilled UnCompleted wells) awaiting higher prices. High initial production rates and faster depletion mean output can be hedged.
These producers are better able to protect themselves from the very swings in price that they themselves might create. The other end of the spectrum is Canadian Tar Sands (the Canadians prefer to call it Oil Sands), where production continued even at February’s lows. This generated operating losses before adding in corporate overhead and an appropriate return on capital. Shutting down a tar sands project, with its buried pipes carrying steam to heat the bitumen, risks the infrastructure freezing and cracking. They had little choice but to continue production. New tar sands projects are unlikely. The nimble producer is the swing producer.
U.S. Energy Independence in both natural gas and crude oil are within sight. Furthermore, natural gas liquids (such as Ethane and Propane) are supporting a new spurt of growth in Chemicals as cheap domestic inputs drive production of plastics for clothing, electronics, food packaging and aerospace equipment.
To state the obvious, we believe the outlook for U.S. energy is very good. And yet, investing in the infrastructure to support this positive outlook is so much more attractive than holding E&P companies. PXD may well go on to make its owners increasingly wealthy, but is in a cyclical business in which financial disaster is one price collapse away. The safer bet is surely the owners of the pipelines, storage, processing facilities and related infrastructure without which none of this potential can be realized. Pipelines are often irreplaceable once built, as communities grow up around and over them. The imperative to connect to the existing network creates insurmountable barriers for would-be new entrants. The impact on midstream businesses from certain of their E&P customers going bankrupt was muted. Debtors taking possession of a defaulting borrower still want cashflow, and in most cases oil and gas production was maintained.
Williams Companies (WMB) is investing heavily in its Transco pipeline network to increase natural gas take-away capacity from the Marcellus and Utica shale regions in Pennsylvania & Ohio. Plains All American (PAGP) is the best placed to profit from increased oil output in the Permian Basin which will use up excess capacity on its pipeline network. Master Limited Partnerships (MLPs), which largely own and operate this infrastructure, will continue to make investments that grow their physical asset base.
As we have written many times before, an MLP’s legal structure has much in common with a hedge fund; both have a General Partner (GP) who’s in charge and gets preferential economics. Hedge fund managers have done spectacularly better than hedge fund clients (see The Hedge Fund Mirage). MLP GPs similarly stand to profit from asset growth in the MLPs they control (see Quarterly Report Cards Provide Comfort). We have invested for years with this outlook, a view that is clearly shared with the people who run MLPs who are overwhelming invested in the GPs.
Stocks are at all-time highs, while the benchmark Alerian Index remains 30% off its 2014 high. Energy infrastructure is in America, largely immune to a strong dollar or a trade war. Many oil and gas producing regions are politically unstable. Reducing our exposure to such regions through self-sufficiency has obvious national security benefits. The U.S. is a far more attractive trade partner than Russia’s Gazprom for example, where maintenance is scheduled around politically-inspired supply disruptions. There is no more compelling sector in public equities today than American Energy Infrastructure.
We are invested in ETE, PAGP, and WMB.
https://sl-advisors.com/wp-content/uploads/2013/04/logo1.jpg00Simon Lackhttps://sl-advisors.com/wp-content/uploads/2013/04/logo1.jpgSimon Lack2017-01-03 09:45:382018-08-07 17:06:29America Is Great!
Although we mostly write about the energy infrastructure sector, we also run an investment strategy designed around low volatility stocks. There’s generally less to say on this sector – we long ago concluded that exploiting the relative under-pricing of such stocks could not be improved much with market timing. So we hold securities we’d be happy to hold for years and generally don’t mess with it too much. We define low vol stocks as businesses that have a long history of steady earnings and dividend growth, above average return on invested capital, moderate need for ongoing capital expenditure, dividend yield above 3% and volatility approximately less than half that of the S&P500. We run three versions of this strategy: Low Vol Long Only, Low Vol Hedged and Low Vol Best Ideas. For more detail about this strategy see Why the Tortoise Beats the Hare and check out our Strategies page.
2016 was a good year for this type of investing – last January we had no idea this would turn out to be the case beyond a suspicion that mean reversion would cause 2015’s relatively flat results to be improved upon. Active managers tend to pick stocks that will move more than the market. Otherwise, demonstrating skill at security selection would take too long. Slow moving stocks deliver their results slowly, and if you’re going to fail at something it’s better to do so quickly so you can move on to the next thing. Consequently, low vol stocks experience little love from the CNBC crowd. This in turn makes them interesting if your goal is the best chance of steady, relatively tax efficient appreciation in your portfolio. We sometimes describe it as low octane equity exposure – good for someone who likes stocks but is wary of a big drop. These stocks will drop too, but generally not as far and when they are down at least they won’t give your wife reason to question your sanity (see How To Invest Like A Woman in our June 2014 newsletter).
We check the results of this strategy every day and I can tell you it’s impossible to predict its performance even if you know what the broader market has done. This low correlation with the S&P500 is complemented by a tendency to do relatively poorly in a strong market and relatively well in a weak one. In a hedged format one might expect it to lose money when stocks are up a lot and make money when they’re down, a useful form of diversification to most portfolios.
This brings us to the outlook for 2017. Since we noted in the first paragraph that we don’t see much benefit to timing this strategy, those looking for such insight will be disappointed. However, we have given more thought than normal to this issue because of the election. Trump’s victory didn’t just suggest alternative employment to pollsters; it has led to significant portfolio shifts as investors adjust to a sharply different outlook for many elements of Federal government policy including fiscal, trade, health care, regulatory and defense.
While the direction of Trump’s policies can be reasonably guessed at, their execution and possible unintended consequences are hard to assess at this point. Fiscal expansion with tax cuts will increase Federal borrowing. The Fed’s glacial pace of tightening will quicken, although on their forecast of three hikes in 2017 we’d take the under. A stronger US$ will moderate GDP growth from being quite as high as fiscal stimulus would otherwise drive it. The specific impact of trade conflict is very hard to predict.
It’s quite possible that stocks could deliver double digit returns next year, propelled by a cyclical upswing in earnings. Low vol stocks would not be the sector of choice in such an environment. Hedged low vol stocks might lose money.
The blogging investment manager creates countless opportunities for public embarrassment, and what follows is potentially another. Our inclination not to modify our low vol strategy in this light reflects not arrogant certainty, but instead a modest acknowledgment that tactical shifts are hard to do well. Investing is all about choices – it’s meaningless to describe an asset class as expensive except by reference to another, cheaper one.
It starts with interest rates, since they (1) define the discount rate at which future cashflows are valued, and (2) represent the main alternative to stocks. Yields on ten year U.S. treasuries may have put in their absolute low in 2016, but that doesn’t mean that they will quickly return to a level which discerning investors might consider attractive. We’ve noted before that the Federal Open Market Committee (FOMC) rarely misses an opportunity to do nothing when a previous Fed chair would have acted. Betting on them not doing what they threaten has worked for long enough now that there seems little point in overthinking things. We’d have to be surprised first before changing our view. So on the Fed’s forecast of three tightenings in 2017, we think two is more likely. For more on our past musings on Bonds see Bonds Are Dead Money.
Assume a ten year yield 0.50% higher at around 3%, and 2017 S&P500 Earnings Per Share (EPS) of $131.75 (the average of the FactSet Top-Down and Bottom-Up forecasts). The Equity Risk Premium in the chart above still favors stocks over bonds. We may be in an environment in which real interest rates (i.e. treasury yields minus expected inflation) are permanently low. If so, we’re unlikely to favor bonds anytime soon. The spread between yields and stocks would need to be at least 2% narrower before we’d assess bonds were competitive with stocks. We’re not holding our breath.
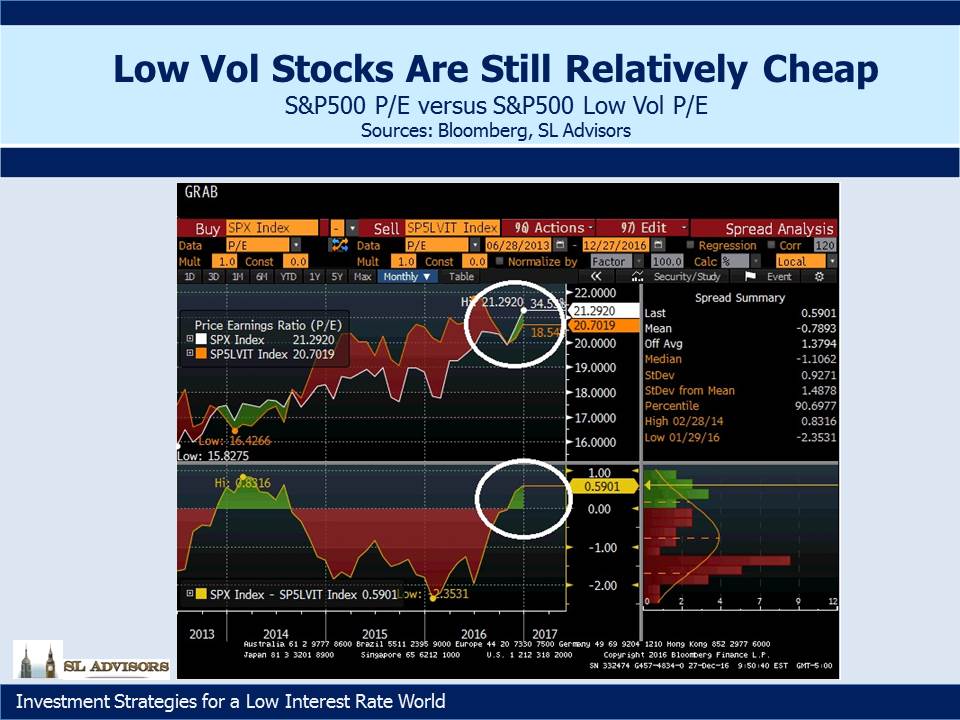
So if the S&P500 continues to offer better prospects than bonds, what about low vol stocks? The macro shifts outlined above have prompted many commentators to question their prospects. And yet, on a relative valuation basis using trailing Price/Earnings ratios, low vol stocks if anything look relatively cheap compared with the broad index. The two areas circled show the S&P500’s P/E of just over 21X with the S&P500 Low Vol Index figure of just under 20X, and compares with their history over the past three years.
The two charts aren’t definitive, but together they provide us with sufficient basis to be optimistic about the long run performance of our low vol strategies continuing. Forecasting the next couple of quarters is very hard, but over longer periods we believe we are increasingly likely to be happy with the result.
https://sl-advisors.com/wp-content/uploads/2013/04/logo1.jpg00Simon Lackhttps://sl-advisors.com/wp-content/uploads/2013/04/logo1.jpgSimon Lack2017-01-01 07:00:192021-09-08 21:25:402017 Low Vol Outlook
By clicking the OK button below, you will be connected to a website maintained by a third party. We are providing a link to the third party’s website solely as a convenience to you, because we believe that website may provide useful content. We do not control the content on the third-party website; we do not guarantee any claims made on it; nor do we endorse the website, its sponsor, or any of the content, policies, activities, products or services offered on the website or by any advertiser on the site. We disclaim any responsibility for the website’s performance or interaction with your computer, its security and privacy policies and practices, and any consequences that may result from visiting it. The link is not intended to create an offer to sell, recommend, or a solicitation of an offer to buy or hold, any securities.
By clicking the OK button below, you will be connected to a website maintained by a third party. We are providing a link to the third party’s website solely as a convenience to you, because we believe that website may provide useful content. We do not control the content on the third-party website; we do not guarantee any claims made on it; nor do we endorse the website, its sponsor, or any of the content, policies, activities, products or services offered on the website or by any advertiser on the site. We disclaim any responsibility for the website’s performance or interaction with your computer, its security and privacy policies and practices, and any consequences that may result from visiting it. The link is not intended to create an offer to sell, recommend, or a solicitation of an offer to buy or hold, any securities.
By clicking the OK button below, you will be connected to a website maintained by a third party. We are providing a link to the third party’s website solely as a convenience to you, because we believe that website may provide useful content. We do not control the content on the third-party website; we do not guarantee any claims made on it; nor do we endorse the website, its sponsor, or any of the content, policies, activities, products or services offered on the website or by any advertiser on the site. We disclaim any responsibility for the website’s performance or interaction with your computer, its security and privacy policies and practices, and any consequences that may result from visiting it. The link is not intended to create an offer to sell, recommend, or a solicitation of an offer to buy or hold, any securities.
By clicking the OK button below, you will be connected to a website maintained by a third party. We are providing a link to the third party’s website solely as a convenience to you, because we believe that website may provide useful content. We do not control the content on the third-party website; we do not guarantee any claims made on it; nor do we endorse the website, its sponsor, or any of the content, policies, activities, products or services offered on the website or by any advertiser on the site. We disclaim any responsibility for the website’s performance or interaction with your computer, its security and privacy policies and practices, and any consequences that may result from visiting it. The link is not intended to create an offer to sell, recommend, or a solicitation of an offer to buy or hold, any securities.
By clicking the OK button below, you will be connected to a website maintained by a third party. We are providing a link to the third party’s website solely as a convenience to you, because we believe that website may provide useful content. We do not control the content on the third-party website; we do not guarantee any claims made on it; nor do we endorse the website, its sponsor, or any of the content, policies, activities, products or services offered on the website or by any advertiser on the site. We disclaim any responsibility for the website’s performance or interaction with your computer, its security and privacy policies and practices, and any consequences that may result from visiting it. The link is not intended to create an offer to sell, recommend, or a solicitation of an offer to buy or hold, any securities.


 he success of horizontal drilling and hydraulic fracturing (“fracking”) in the U.S. was releasing increasing amounts of crude oil from hitherto impenetrable porous rock. A consequence was that from 2011-2014 fully all of the increase in global demand for crude oil had been met by North American production (see
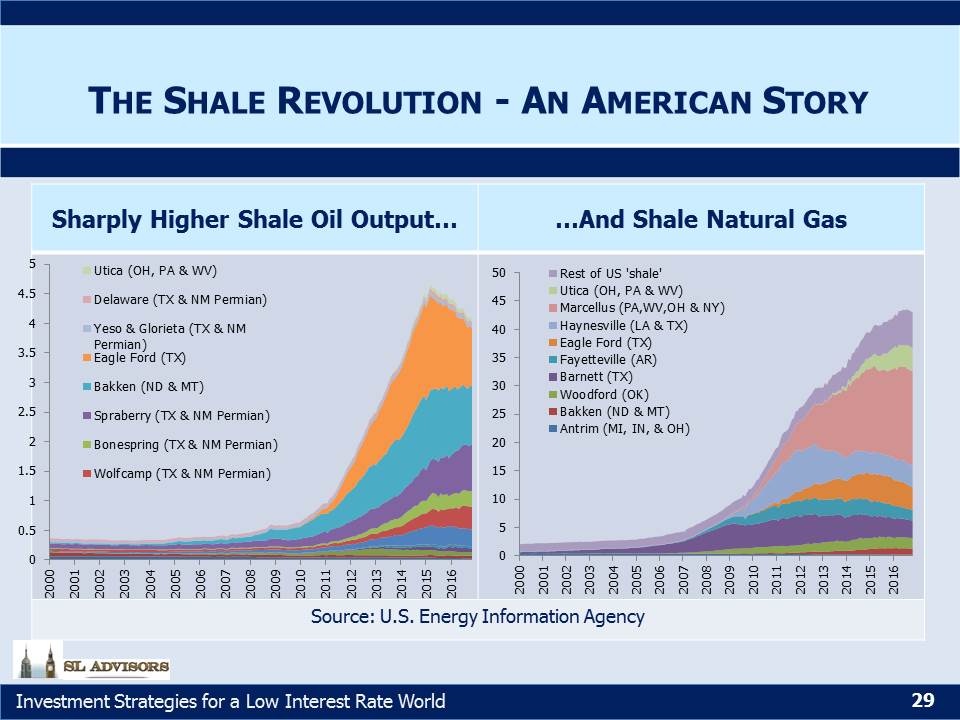
 Shale oil and gas production are upending the energy markets. The U.S. is not just the leader in this new technology, it’s virtually the only game in town. Oil, natural gas liquids and natural gas are known to exist in porous rock all over the