Can MLPs Go Global?

We’re into earnings season for public companies including Master Limited Partnerships (MLPs). Quarterly report cards on performance should provide useful information on the nascent recovery in the U.S. energy sector.

When they reported 3Q16 earnings Buckeye Partners (BPL) caught our attention with their investment in VTTI BV, a global owner of storage and terminalling assets headquartered in the Netherlands. VTTI BV is owned by Vitol, a privately held energy company. Beneath VTTI BV is a publicly traded MLP, VTTI Energy Partners, LP (VTTI). BPL and VTTI/Vitol  are in similar businesses, albeit BPL is in the U.S. while VTTI/Vitol are worldwide.

BPL has bought 50% of the General Partner of VTTI for $1.1BN, an investment whose returns are virtually all going to come outside the U.S.. It’s quite a thought provoking move. The MLP structure is a consequence of the U.S. tax code. MLPs generally don’t pay tax on their income because their investors do. There are substantial tax disincentives for non-U.S. investors and U.S. tax-exempt investors to invest directly in MLPs. It’s not impossible but in most cases prohibitively costly. Because MLPs aren’t taxed, they have a cost of equity capital advantage over an otherwise identical business structured as a C-corp.

(Diagram from Buckeye’s presentation on the deal)

But this advantage ought not to extend beyond the U.S. The profits  earned by a refined product terminal located in, say, New York aren’t taxed at source because the investors are U.S. taxable and report their proportional share of the income on their tax return via a K-1. But why would the Dutch, or South Africans similarly extend this advantage to physical assets in their country owned by VTTI, a U.S. listed MLP? And in fact they don’t, which ought to eliminate the MLP cost of equity advantage and restrict the MLP structure to holding U.S. assets.

VTTI is a partnership but chooses to be taxed as a corporation. And it does pay tax, at an average rate of 24% over the past four years according to their 2015 10K. The Netherlands, Malaysia, U.S. and Belgium all receive tax from VTTI, reflecting their far-flung footprint. So we have a tax-paying entity with a GP entitled to Incentive Distribution Rights (IDRs), a low growth investment that trades at a 7.3% yield based on their most recently declared quarterly distribution of $0.3281.

Most MLP GPs are earning 50% of the marginal dollar of Distributable Cash Flow (DCF) earned by the MLPs they control. VTTI isn’t yet there. IDRs come with DCF thresholds, similar in concept to the marginal tax rates that kick in as your income rises. VTTI’s GP is at the top of the 15% IDR share. Beyond $0.328125 per unit they get 25% and above $0.39375 they get 50%. Vitol, and now BPL, will increasingly participate in per unit DCF growth. Vitol  retains storage assets at the parent level which they can sell (“drop down”) to VTTI as well as $600MM of new projects under consideration. So there’s some visibility around how they might grow DCF.

The question is, why is this structure working with non-U.S. assets whose income is already being taxed before it reaches the equity owners? For the answer, look to Williams Companies (WMB). In August, we noted that WMB had recognized they had two types of investor: income-seeking MLP investors who hold Williams Partners (WPZ), and growth seeking investors who hold WMB. So when WMB cut its dividend in order to invest in WPZ, both sets of investors found something to like. WPZ investors liked the support this gave to their distribution, while WMB investors cheered the redirection of their dividends into a high yielding security. Both securities rose. WPZ is “YieldCo”, generating steady income. WMB is “GrowthCo”, with better growth prospects. In Williams Satisfies Two Masters we explained our thinking.

The VTTI structure works because VTTI investors are most focused on income, and won’t drive the yield on VTTI down much for the promise of faster growth. So that growth is partly redirected via the GP IDRs to VTTI BV, and now to BPL as well.

It’ll be interesting to watch, because on the earnings call BPL didn’t identify operating synergies as being that important to them. They are financial investors in a sector they know pretty well. They now own a GP. The MLP model  is showing its applicability globally, not through a tax advantage but via its ability to separate cashflows and meet the specific needs of different investor segments, lowering its cost of equity.

We are invested in BPL and WMB.

Prospects Continue to Brighten for U.S. Energy Infrastructure

A few seemingly unrelated pieces of news caught our attention last week. Together, they provide a useful perspective on why U.S. energy infrastructure offers such an attractive return potential.

Khalid al-Falih, Saudi Arabia’s Energy Minister, warned of a looming shortage of crude oil with the risk of a consequent price spike. This may seem like an odd concern given last year’s collapse in prices, but the Saudis are looking farther ahead than the drawdown of existing stockpiles. He recognizes that the $300-400BN slashed from drilling budgets this year, and the estimated $1TN cut through 2020, will lead to much less new supply coming online than might have been the case had oil stayed at $100 a barrel where it was in 2014. There’s a substantial time lag between committing to a new project and producing oil. Volatile prices hurt demand, and are therefore not in the interests of suppliers either. We wrote about precisely this issue in Why Oil Could Be Higher for Longer.

However, Rex Tillerson, Exxon Mobil (XOM) CEO, offered a contrasting view based on the resurgence in shale output in the U.S. being capable of responding to higher prices with increased output.  Unlike conventional oil projects with their large upfront investment and long payback times, shale drilling involves numerous fairly cheap wells and high initial production. This means payback times are shorter and production can be quickly curtailed when prices are adverse (see Why the Shale Revolution Could Only Happen in America). On their recent earnings call, Haliburton CEO Dave Lesar said, “…North America has assumed the role of swing producer in global oil production.”

Either of these views on oil could be right. In each case, it will be good for U.S. producers and their infrastructure providers.

Related to this, there’s a growing disconnect between falling capital expenditure (capex) by companies drilling for hydrocarbons and their rising production. Antero Resources (AR) has cut capex by 20% since last year while production is up 14%. EQT Corporation cut capex 41% and raised production by 31%. Consol Energy (CNX), -74% and +16%. Exploration and production companies (E&P) are managing substantial improvements in efficiency, which speaks to Rex Tillerson’s comments above.

The chart above shows what’s happened in the Permian Basin in Texas, currently one of the most productive regions in the U.S. Using data from the U.S. Energy Information Administration (EIA), the rig count fell 75% from September 2014 to May 2016 while production increased 19% over the same period, representing a dramatic improvement in efficiency and lower break-evens for E&P companies. This is pointedly not what the Saudis expected when they increased output in 2014 so as to expose the weak business models of shale drillers.

Finally, a few weeks ago (see There’s More to Pipelines Than Oil) we noted a documentary made in the 1950s about the Transcontinental Gas Pipe Line, later called Transco and today owned by Williams Companies (WMB). It’s worth watching. In 1931 the Natural Gas Pipeline Company of America built a transmission pipeline from Texas and Louisiana to Chicago. It is still in use today, owned by Kinder Morgan (KMI). Properly maintained, infrastructure lasts a long time – far longer than the depreciation schedules used under GAAP accounting, which is why net income is generally less useful than cashflow less the cost of maintenance (Distributable Cashflow, or DCF) in measuring performance. GAAP Depreciation, a non-cash expense, depresses net income and understates the cash flow generating capability of an asset that doesn’t depreciate according to a GAAP schedule. Pipelines more typically increase in value over time, because they’re hard to replicate. On KMI’s earnings call on Wednesday, chairman Rich Kinder noted the challenges in building certain new projects such as in New England because of the regulatory environment, but added, “…to the extent it becomes difficult to build new infrastructure, that tends to make existing pipeline networks more valuable.”

U.S. energy infrastructure remains one of the most interesting places to invest.

We are invested in KMI and WMB.

Natural Gas Liquids — the Lesser Known Side of the Shale Revolution

Many people think of fossil fuels as coal, crude oil and natural gas, with the nastiness of their toxic emissions lying in that order. Among the less colorful comments during the second Presidential debate was Hillary Clinton’s reference to natural gas as a “bridge” fuel, sitting between today’s reliance on hydrocarbons and a future of renewables (solar, wind and so on). Methane (or, to use its Chemical symbols, CH4 since it combines four hydrogen atoms with one Carbon atom), is colloquially known as natural gas, and is the simplest and cleanest burning fuel.  It  is helping the U.S. limit its carbon footprint since as the Shale Revolution has made it plentiful domestically, it’s replacing far dirtier coal as the fuel of choice for power plants.

Natural Gas Liquids (NGLs) are a set of hydrocarbons that lie between Methane (also called “Dry” Gas”) and the lightest blends of crude oil (such as Naphtha). Methane is often extracted mixed with NGLs and crude oil.  It’s used for residential gas stoves and heating, electricity generation and, when chilled to -260F turns to Liquid Natural Gas (LNG) in which form it can be transported by ship. The mix of NGLs and oil found in a well with methane affects the value of the play since after being separated from the dry gas the NGLs can be put to other purposes.  “Wet” gas wells that contain more NGLs often generate more attractive returns as NGLs fetch higher prices.

The energy infrastructure business provides the ability to gather and process the mix of hydrocarbons into Gas, NGLs and Crude Oil.  Dry gas then is piped to customers, crude oil heads to storage & refiners, and NGLs are sent to fractionation plants.  By exploiting their different boiling points the NGLs are then separated into into their components: Ethane (C2H6), Propane (C3H8), Butane(C4H10), Iso-Butane (C4H10 with tertiary carbon), and natural gasoline (C5+). Although NGLs are gases, their production is usually expressed in barrels a day, like oil. The conversion is based on energy equivalence, so a barrel of an NGL has the same energy output measured in BTUs (British Thermal Units) as a barrel of oil. Nothing gets moved in barrels anymore, but the industry has retained it as a common measure of volume.

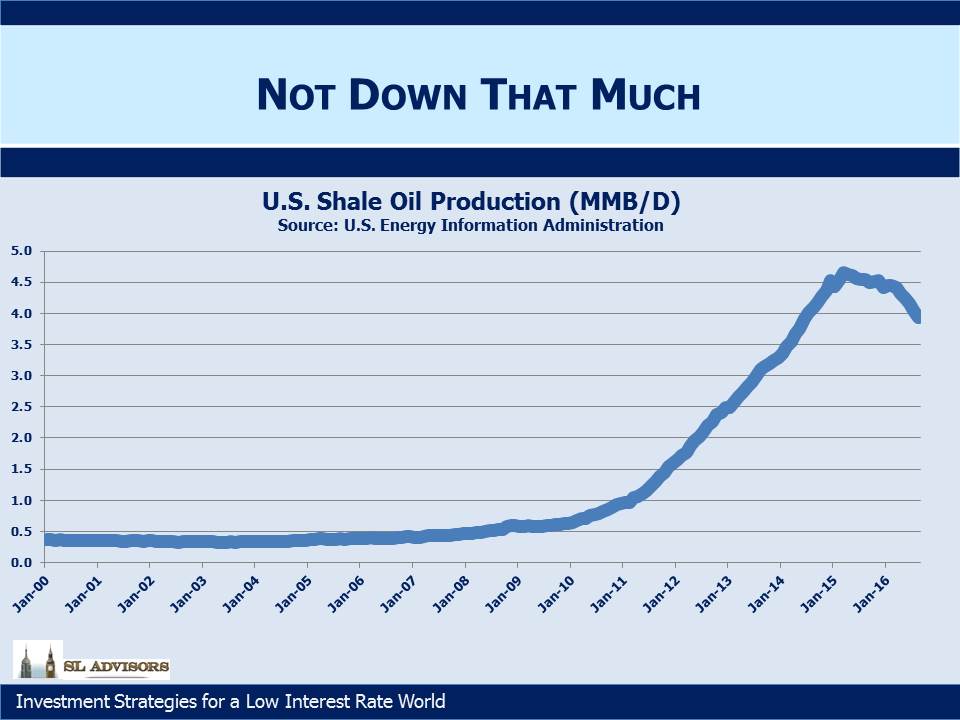
Although often ignored, NGLs are significant. The U.S currently produces 3.6MMBD (Millions of Barrels a Day) of NGLs.  Compare this with U.S shale oil production of 4.5MMBD  and it’s a big business in its own right.

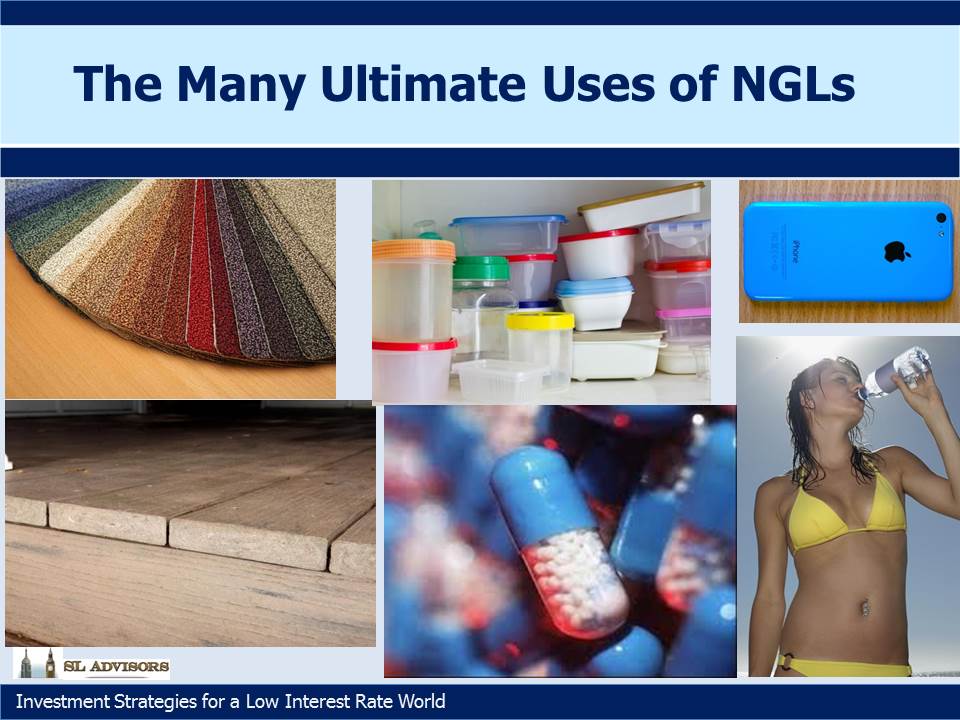
Ethane is most readily found with methane, although it’s also a by-product of refining crude oil. Some portion of ethane can be left in the gas stream for residential and commercial use if its price doesn’t justify separating it out. However, by far its most important use is as a feedstock for petrochemical plants to produce polyethylene, the most commonly created organic compound in the world. It winds up as plastics in various forms with thousands of ultimate uses across consumer products as packaging, containers, plastic bags carpeting and clothing (including swimwear). As the U.S. steps up its production of ethane, the low price caused by America’s shift towards energy independence is leading to a substantial cost advantage in polyethylene production. Currently the U.S produces 1.3MMBD of ethane.

Credit for the first industrial synthesis of polyethylene generally goes to Imperial Chemical Industries (ICI) in the UK in 1933.

Propane exists as a gas at temperatures above -44F, but turns to a liquid under pressure when it occupies 1/270th of the space, allowing it to be stored in propane tanks and bottles (such as the one under your gas grill outside).  It has many other uses as a fuel from heating homes (particularly mobile homes which often lack a permanent connection to the local gas supply) to drying crops.  The U.S produces 1.15MMBD of Propane. Butane is the fuel in pocket lighters, the propellant in aerosols, and is blended with gasoline during the summer to reduce pollution (it’s the vapors that come out while you’re pumping).  Iso-butane is primarily used to increase the octane in gasoline while making it cleaner burning.  The U.S produces 300MMBD each of butane and i-butane.

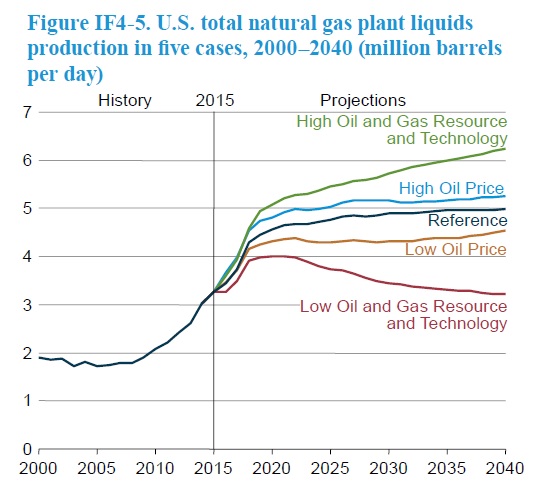
The chart below shows forecast growth in NGLs (referred to as “Natural Gas Plant Liquids”) provided by the U.S. Energy Information Administration (EIA) in their 2016 Annual Energy Outlook.

The first point of this brief summary on NGLs is to illustrate that the composition and uses of the hydrocarbons we produce vary enormously. Master Limited Partnerships (MLPs) own and operate the pipelines, storage assets and processing facilities that handle this output, which includes providing treatment and separation of methane from the NGLs with which it’s found.  They process the mixed NGLs into their individual components, providing storage and then transportation of the pure products to their end users.

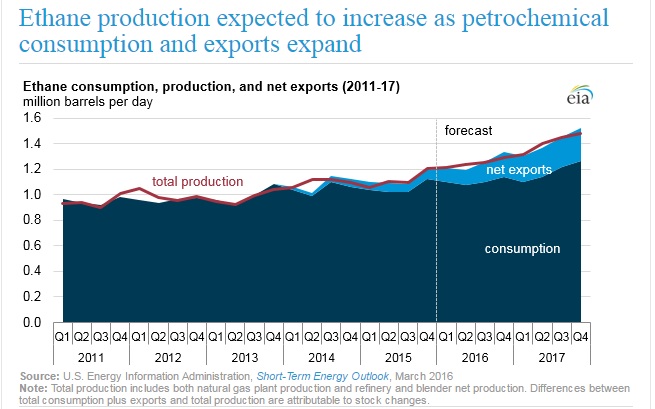
The second point is that, just as natural gas and crude oil production look set to continue growing in the U.S., so does NGL output. Their increasing use is another side to the story of energy independence. Moreover, exports are increasingly driving this growth; as recently as 2014 the U.S. was a net importer of ethane, and marine exports were not considered economically viable.

According to the EIA, U.S. production of ethane and propane have substantially exceeded demand in recent years. This has led to ethane at times being “rejected,” meaning some portion of it is left with the methane in the natural gas supply rather than being separated out. But the growing supply of ethane has also has led to significant investments in petrochemical plants and export capacity.

Ethane exports were non-existent before 2014 when two pipelines  came online to ship it to petrochemical complexes in Canada.  Pembina’s (PBA) Vantage pipeline recently added 70KBD (Thousands of Barrels a Day) of capacity from North Dakota,  and Sunoco Logistics (SXL) moves  50KBD from their Mariner West line in southwestern Pennsylvania. In March of this year the first waterborne ethane left SXL’s Marcus Hook terminal on the Delaware River just south of Philadelphia, headed for Norway. Subsequent shipments for Norway have also left  from Texas. Just as the U.S. is selling methane to the Middle East, a region not exactly short of it (see Coals to Newcastle), we’re able to sell to Norway even though they produce almost 4MMBD equivalent of crude oil, NGLs and natural gas.

In July, refrigerated ships began taking ethane from Enterprise Products Partners’ (EPD) 200KBD Morgan’s Point terminal, now the largest ethane export facility in the world, on the Houston Ship Channel. We are in the middle of the ramp-up now as ethane export capacity is expected to increase from 65KBD in 2015 to almost 400KBD by the end of next year.  Additionally, Kinder Morgan’s (KMI) 50KBD pipeline from eastern Ohio is expected to come online early 2018.  Adding in propane & butane docks, the U.S will have waterborne Liquid Petroleum Gas (LPG, NGLs when they’re condensed to liquid form for transport) capacity of 1.5MMBD by 2017.  This includes  1.2MMBD on the gulf coast held by Targa Resources (TRGP), EPD, Phillips 66 (PSX), Occidental Petroleum (OXY), and SXL. There’s an additional 275KBD in the northeast being developed by Energy Transfer Partners (ETP) and SXL. In other words, there’s a lot of energy infrastructure being built that will increase MLP cashflows.

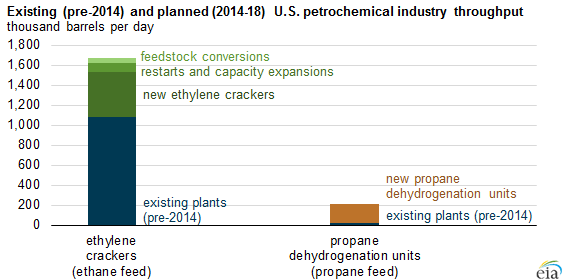
Domestic processing of ethane into ethylene has risen by almost a third in the last three years. Demand from ethylene producers for ethane feedstock is expected to soak up another 600KBD in the next five years, a more than 50% jump from today’s level.  Propane can be converted into polypropylene, with similarly wide application in plastics to polyethylene although polypropylene is produced as a clear plastic whereas polyethylene is opaque, like a milk jug. Polypropylene production capacity has tripled since 2013 and is expected to consume another 135KBD of propane in the next five years. With all the new demand for NGLs, pipeline capacity is being expanded in multiple regions. Examples include Oneok Partners’ (OKS) Bakken NGL network; EPD’s Aegis system on the Gulf of Mexico and EPD’s ATEX line from the Northeast to the gulf; SXL’s Mariner East line.

New pipelines are being built, such as KMI’s Utica Marcellus Texas pipeline, and idle ones re-purposed, including a JV between EPD and Marathon Petroleum (MPC) called  Centennial. Another example is NuStar’s (NS) Mont Belvieu line to Corpus Christi.

The picture of widespread investment in new midstream energy assets is clear enough. Last year’s sellers of MLPs gave no heed to the secular theme that is unfolding.

The chart below shows how the petrochemical industry is gearing up to process increasing volumes of ethan and propane into plastics.

Natural gas and crude oil for power generation tend to dominate the headlines about the Shale Revolution. But the associated production of NGLs and their use in wide-scale production of plastics represents a growing and increasingly important part of the economics of domestic hydrocarbon production. Fully utilizing this resource is another driver of demand for new energy infrastructure, another source of growth for MLPs. Unsurprisingly, we are invested in many of the names listed, often through their General Partner (GP) since that’s where the returns to growth are best realized. Of the names mentioned above, we are invested in the following:

EPD, Energy Transfer Equity (ETE, GP of ETP and SXL), KMI, NuStar GP Holdings (NSH, the GP of NS), Oneok (OKE, the GP of OKS), PBA, PSX (GP to PSXP) and TRGP.


U.S. Natural Gas Exports Taking Off

A couple of months ago we wrote about how the U.S. had sent a shipment of Liquid Natural Gas (LNG) to the United Arab Emirates (see Coals to Newcastle). The notion of natural gas being extracted under a field in Pennsylvania, processed and then transported by pipeline to Louisiana, chilled and condensed to liquid form, loaded onto an LNG tanker and then sent to a part of the world that’s the world’s major hydrocarbon supplier is amazing. It probably reflects better than most things how the worlds of natural gas and crude oil have been upended by the Shale Revolution. So far this year, U.S. sourced LNG has also shipped to Brazil, Chile, Portugal, China, India, Jordan and Kuwait.

Ten years ago when the U.S. was importing around 10 BCFD (Billion Cubic Feet per Day) of natural gas, the idea that some of that would arrive by LNG tanker was uncontroversial. Cheniere Energy began planning facilities such as Sabine Pass to accommodate such flows. As natural gas became steadily more abundant in the U.S., Cheniere reversed themselves and planned for its export via LNG tanker. Although their chosen site had deep water access and connectivity to the domestic network, switching a facility from LNG imports to exports isn’t trivial. Former Cheniere President Charif Souki, who led the company through this metamorphosis, is one of the industry’s most colorful characters.


The U.S. is within sight of being a net exporter of natural gas. Additional LNG export facilities are at various stages of development. However, other countries are also increasing their export capability and it’s quite possible the world will have more LNG available than it needs for several years. So far, virtually all the shift in the U.S. balance of trade in natural gas has taken place through pipelines. Canada has long been a net exporter to us although flows go both ways and our net imports from Canada are down by almost half in ten years. We’ve exported to Mexico for thirty years but in recent months volumes have really taken off. Early last year exports to Mexico exceeded those to Canada and the gap keeps growing.

Several new pipeline projects are at various stages of development. Between supplying gas for LNG export facilities and increasing Mexican exports, there’s a lot of energy infrastructure being built. One of the clear beneficiaries is Williams Companies (WMB), whose Transco pipeline is the main recipient of their capital expenditures to accommodate growing demand.

But other midstream infrastructure companies involved in Mexican trade include TransCanada (TRP), Spectra (SE), Energy Transfer Equity (ETE) and Oneok (OKE).

In many cases their Master Limited Partnership (MLP) will build the assets and then share the Distributable CashFlow with their General Partners (GPs) via Incentive Distribution Rights as is common. This asset growth will benefit the GPs. Just as asset growth for a hedge fund benefits the hedge fund manager, or GP, so does asset growth for an MLP benefit its GP. An MLP GP is like a hedge fund manager.

We are invested in ETE, OKE, SE, TRP and WMB

OPEC Blinks

OPEC Blinks

Last week OPEC announced a plan to reduce their crude oil production, from August’s level of 33.23 MMB/D (Million Barrels a Day) to somewhere between 32.5 and 33 MMB/D. The last time OPEC agreed to curb output was in 2008.

Healthy skepticism correctly greets OPEC’s pronouncements on production curbs. Saudi Arabia is the only country with much ability or desire to manage output and therefore prices. A cartel that controls a third of global output is hardly in much control, and widespread cheating over the years has not helped to create an environment of mutual trust among OPEC’s members. Nonetheless, there’s no doubt that some type of accord to reduce output is in their interests given the relative inelasticity of oil supply over even the intermediate term. So the fact that the Saudis and Iranians keep coming together for talks, albeit inconclusive perhaps until recently, illustrates that they’d both like to get to an agreement.

It’s interesting to review how we got here from $100 oil just over two years ago. In 2014 Plains All American used the chart below in their investor presentations, and it neatly encapsulates the dilemma facing OPEC at that time. New global demand was increasingly being satisfied by North American producers. In fact, the 3MMB/D Cumulative Demand Growth from 2011-14 in this chart pretty much matches the increase in U.S. shale oil output over the same period of time. OPEC, or the Saudis, recognized that they were losing market share to the upstart, high cost U.S. shale industry and decided to expose its cost structure.

What follows is a great story of American ingenuity. Although financial pain and bankruptcies continue to occur in the U.S. energy sector, Exploration and Production (E&P) firms have furiously innovated, discovered new technological enhancements, demanded cost reductions from their service providers and adapted to oil under $50 a barrel. Consequently, while U.S. shale oil production dipped it remains around the levels it was in 2014.

The oil rig count shows signs of bottoming, and U.S. production was already looking as if it may not drop much further before last week’s announcement. The rig count chart shows that the industry has cut its use of rigs by 75%, reflecting substantially improved operating efficiencies.

The asymmetry is quite delicious; the governments of almost half the world’s oil production (since Russia is also sporadically involved in discussions around output) regularly meet to plot the path back to higher oil revenues. Meanwhile the U.S., whose output ostensibly caused the supply imbalance, doesn’t even have an official view on U.S. oil production. Private industry representing the U.S. at its best is combining technological expertise, access to capital, a relentless drive to cut costs and raw entrepreneurialism. The Saudi’s have little to show for their strategy of increasing output beyond steadily depleting their stock of financial assets as they draw on them to fund a gaping budget deficit.

The Saudis may have simply concluded that enough is enough. Or they may be considering the long game. Conventional new supply comes online slowly, typically requiring several years of development. The $1TN of reductions in capex for exploration (see Why Oil Could Be Higher for Longer) run the risk that the roughly 6MMB/D of new supply that’s needed annually to meet depletion and new demand won’t be there at anything close to current prices. There’s some risk of a substantial run-up in prices 2-5 years out. Allowing prices to rise now can stimulate new exploration and reduce the risk of such an imbalance.

Whatever the OPEC strategy, the clear beneficiaries will include the U.S. shale oil industry and the infrastructure providers that support it. They have the shortest reaction time, and can bring on new supply within a couple of quarters or so. By acting as the swing producer, U.S. production will impede the higher price that would make other conventional projects viable. As the Saudis are learning, it’s not good to bet against the American private sector.


Gallic Justice

In 2008 Jerome Kerviel, a trader at Societe Generale, cost his employer €4.9BN when his unauthorized trading spectacularly blew up. Kerviel was sent to prison and assessed €4.9BN in damages. Last week, a French court reduced the damages claim to just €1MM, on the basis that the bank’s poor controls were to blame.

Implausibly, back in June Kerviel also won a wrongful dismissal suit against SocGen that awarded him €400K. Although he had accumulated positions that were nearly twice the value of the entire bank, the tribunal found that he was fired, “without real and serious cause”. And yet, even had SocGen refrained from this most reasonable action and not fired him, Kerviel would nonetheless have been unable to show up for work because he was in prison. Therefore, the tribunal presumably believes this extended absence from his place of work would also have been insufficient grounds for dismissal. You just can’t make this stuff up.

image_pdfimage_print