There's More to Pipelines Than Oil

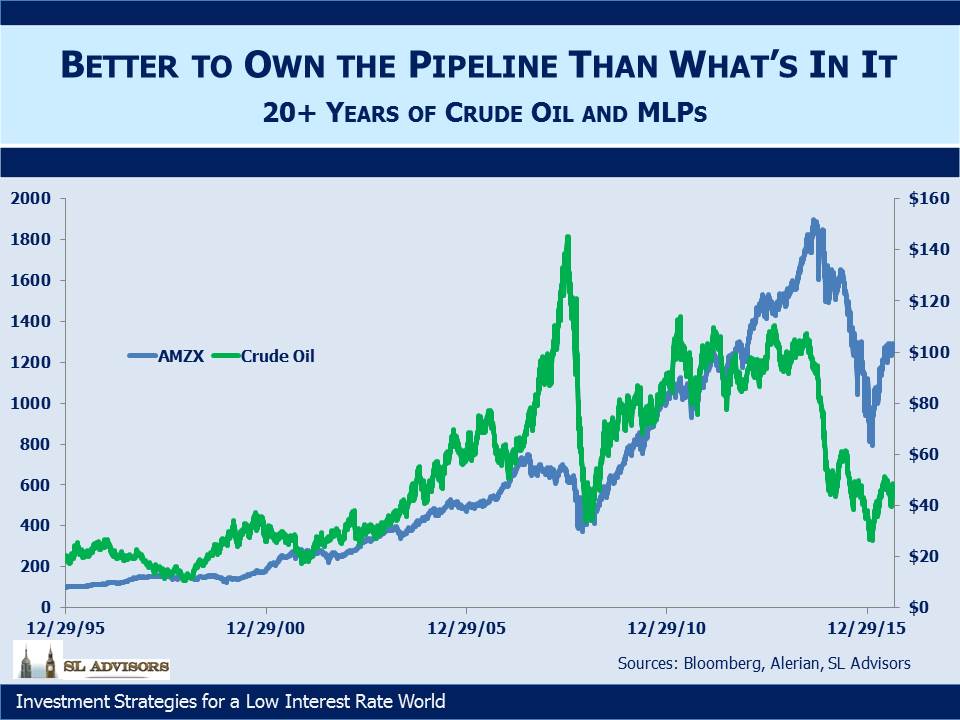
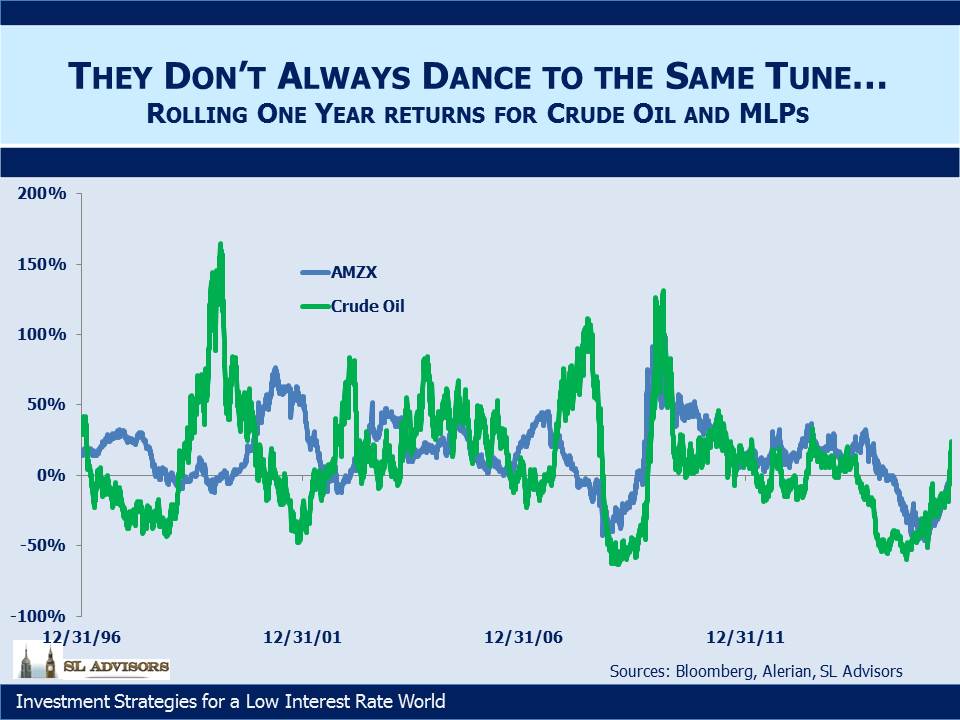
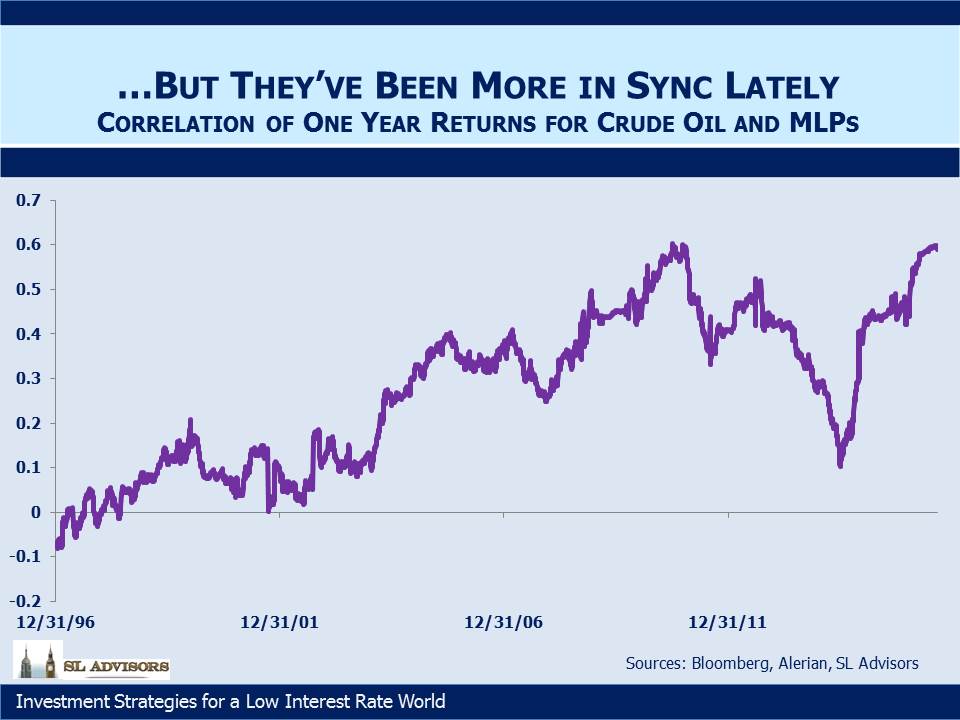
If I had $1MM for every time an MLP investor has asked me where crude oil is going, well I could probably buy a good chunk of Plains All American (PAA), the biggest crude oil pipeline operator in the U.S.

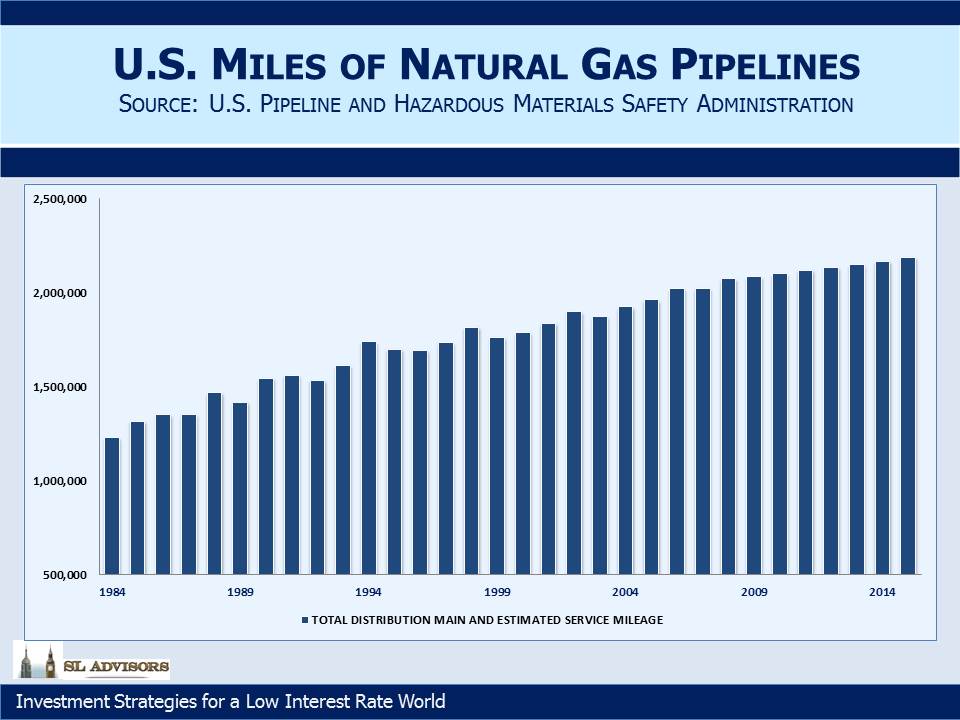
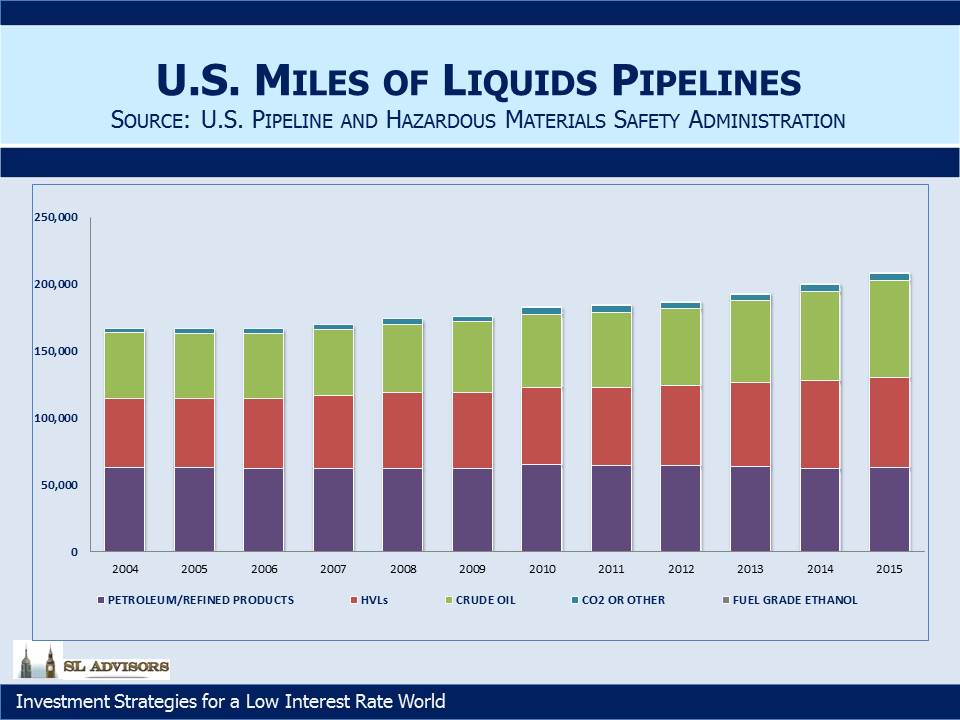
But PAA aside, MLPs are not as closely aligned with crude oil as popularly believed. The charts below show in raw numbers how many miles of U.S. pipelines are dedicated to crude oil, refined products, Natural Gas Liquids (NGLs) and natural gas. We have over 2 million miles of transmission capacity for natural gas. While a good portion of that travels the last few yards to a residence or business, almost 1.3 million miles is classified as “Distribution Main” mileage. On pure miles of pipeline, natural gas swamps anything else. Their owners are diverse and include utilities as well as MLPs. The network of gas pipelines has been growing, to accommodate America’s increasing use of natural gas for heating, electricity generation and other industrial uses.


The Energy Information Administration (EIA) counts 300,000 miles of inter-state and intra-state transmission pipelines which are largely controlled by MLPs.


We have over 200,000 miles of pipelines carrying hazardous liquids, which are roughly evenly split amongst petroleum/refined products, NGLs (referred to as HVLs) and crude oil. The last two categories have been responsible for the growth in this sector.


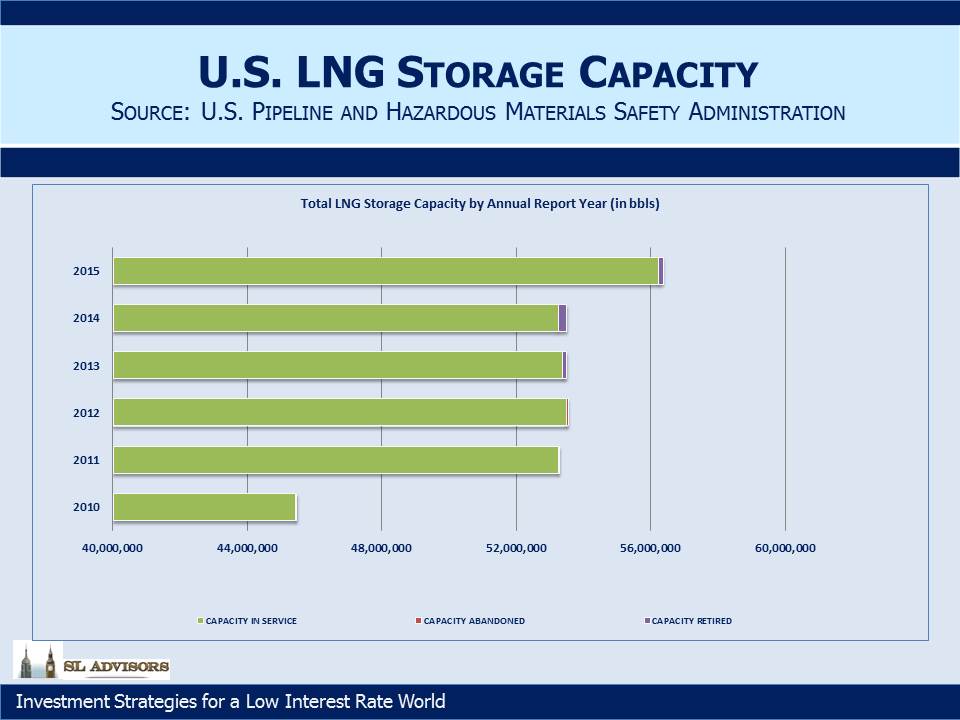
We’re also storing more NGLs too, and the chart below shows a recent jump in storage capacity (measured in Millions of Barrels).


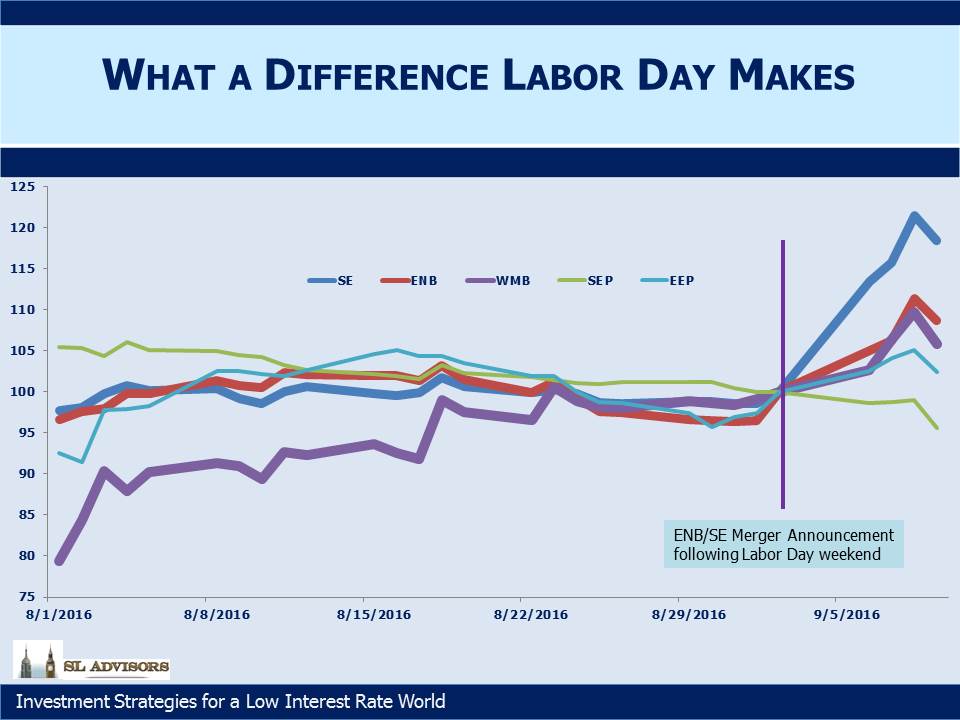
Meanwhile, spending on new infrastructure has continued although the 2015 MLP Crash did lead to the deferral of some projects. There have also been some notable cancellations because of the often complex approval process. Kinder Morgan (KMI) halted their North East Direct project because they were unable to obtain enough capacity commitments. This was in part because in Massachusetts there’s no financial incentive for a utility to secure long term supply, which limited their interest in signing up for pipeline capacity. Access Northeast, another effort to improve distribution and storage for New England under the direction of Spectra Energy (SE), may also be cancelled for similar reasons. A surprising consequence is that Boston now imports Liquified Natural Gas (LNG) by ship for use in winter, even while the U.S. is beginning to export it. LNG has to be liquefied for storage and regassified for use, a not trivial expense borne by the helpless consumers in the region.

It’s not uncommon to hear energy sector executives complaining about the present Administration and their opposition to fossil fuels. The increases in crude oil and natural gas production over the past eight years weaken the case for critics, although the drawn out and eventual cancellation of the Keystone pipeline project did not reflect an enlightened energy policy. More recently, the Dakota Access Pipeline (DAPL) project run by Energy Transfer Partners (ETP) has been the victim of some hostile and possibly illegal moves by the Administration. It is too long a story to recount, but a good description is on Forbes (see Why The DOJ Order To Shut Down Construction On The DAPL Pipeline is Legally Indefensible). While the opposition to new projects such as this hurts many unwitting participants including consumers who’d benefit from cheaper energy, such difficulties can only enhance the value of existing infrastructure. Given the unpredictability of the approval process as shamefully on display in the DAPL case, a new build looks ever more daunting compared with extracting higher returns out of existing assets.

In fact, on this point we recently ran across a very old documentary (sometime in the 1950s) highlighting the Transcontinental Gas Pipe Line Corporation as it traverses from Texas north through the eastern U.S. to New York City. If you have twenty five minutes to spare it’s worth watching. It reminds how energy infrastructure has a useful life of decades and is in many cases impossible to replicate as communities develop around and over it. Today Transco, as it is called, belongs to Williams Companies (WMB).

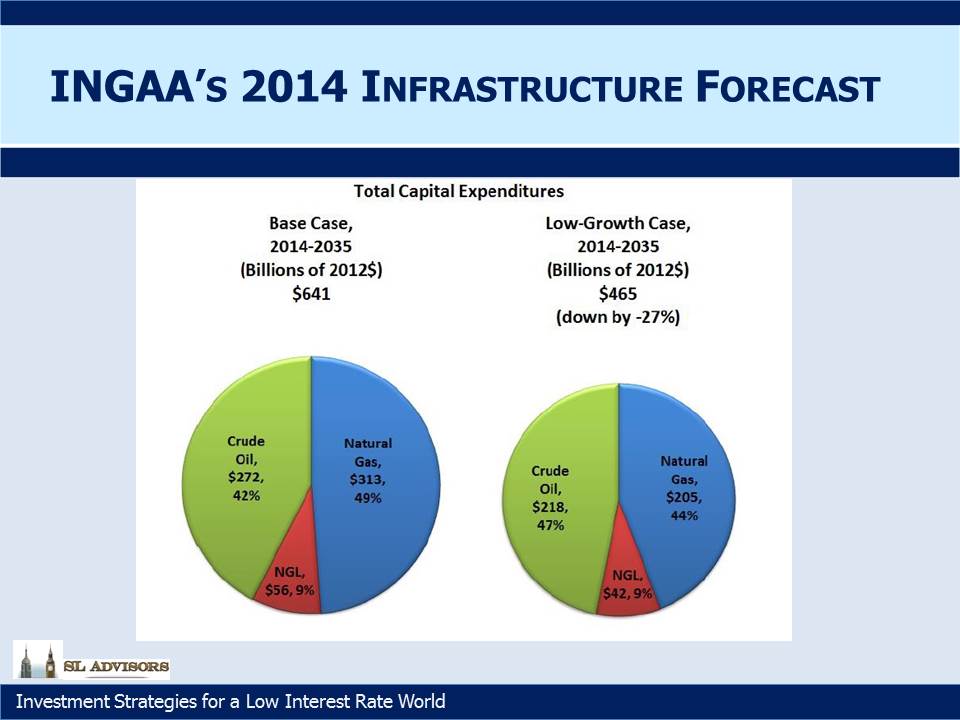
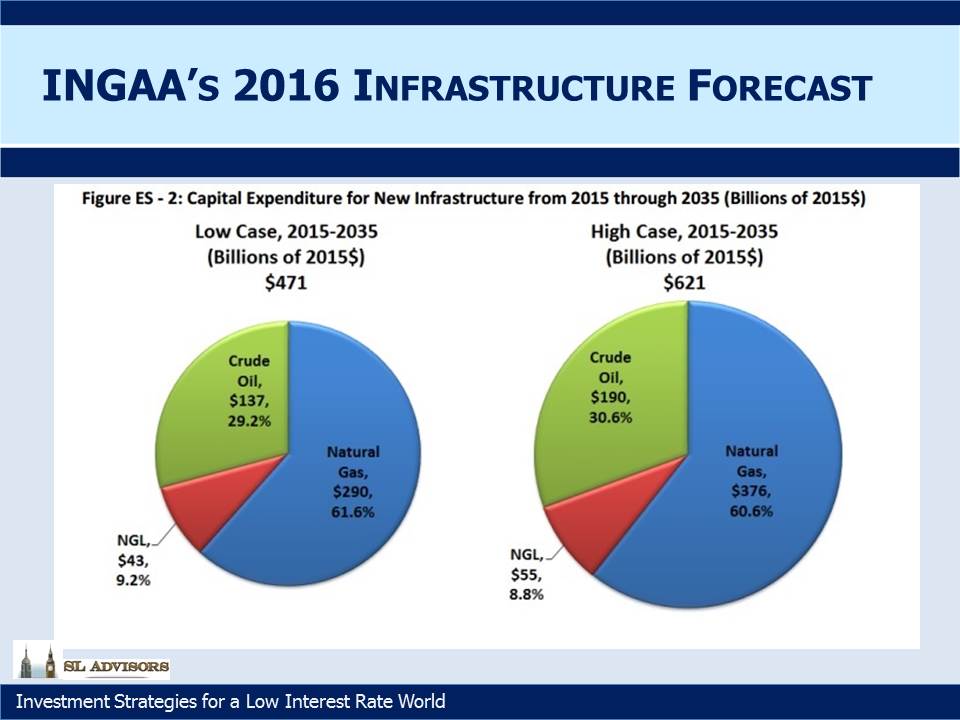
What has changed over the past couple of years is that the planned new infrastructure dedicated to natural gas has grown while crude oil projections have fallen, as forecast by the Interstate Natural Gas Association of America (INGAA). The charts below compare 2014 and 2016. The prospect of MLPs investing approximately two times their current market capital in new projects over the next twenty years hasn’t been much altered. MLPs and crude oil are gradually disengaging (see MLPs and Crude Oil, the Improbable Dance Partners). Just as hedge fund asset growth is good for hedge fund managers, MLP asset growth should be good for MLP General Partners. At a time when the Federal Reserve continues its benign interest rate policy of wealth transfer from savers to borrowers (see The Shrinking Pool of Cheap Assets), MLPs remain one of the few asset classes to offer attractive valuations.

We are invested in KMI, SE and WMB


Growing Without Paying For It

Investors in Master Limited Partnerships (MLPs) like their distributions to be reliable and, by comparison with other asset classes, generous. Investors in the General Partners (GPs) that control them hold a more discerning view on value creation. Last month we highlighted how Williams Companies (WMB) was giving its MLP investors in Williams Partners (WPZ) what they want (reliable, high distributions) while also meeting the different needs of WMB investors for total return (see Williams Satisfies Two Masters).

The slide below from a recent WMB investor presentation lays it out nicely. WMB has two sources of cashflow – LP distributions from WPZ (since it owns WPZ units) and Incentive Distribution Rights (IDR) related cashflows from their GP interest. These two items are expected to generate 1.2BN and $1BN respectively for WMB over the next twelve months.

Move right across the bar chart and they’re planning to invest $1.3BN annually in new projects, by investing in new units of WPZ. These new WPZ units will generate additional IDRs through WMB’s GP interest. Working through the numbers, WPZ will supplement the $1.3BN it receives for selling new units to WMB with $1.2BN in debt, giving it $2.5BN to invest in new projects.

We know from other regulated projects that WPZ’s minimum IRR target is 15% on invested capital. The table below shows how this cashflow will divide up. WMB receives on average 32% of WPZ cashflows (i.e. the $1BN GP take is 32% of the $3.1BN total WPZ Distributed Cash Flow, the left-most bar on the chart). So WMB should expect 32% of the project’s cashflows and WPZ LP unitholders 68% up to a 9.4% return on the LP units (the current yield on WPZ). Thereafter, since the GP is at the 50% level on IDRs, the excess cashflow is split equally.

The total IDR take for WMB from the $2.5BN WPZ capital outlay is $131MM, representing a 13.1% growth rate on its current $1BN GP IDR receipts. WMB can if it chooses sell the $1.3BN in WPZ LP units acquired into the open market at a time of its choosing, thus winding up with no net cash outlay in exchange for this growth.

So what’s it worth? The LP cashflows are pretty straightforward. $1.2BN in WPZ distributions less the $300MM in cash operating costs leaves $900MM, valued at the market yield on WPZ units of 9.4% gives $9.6BN.

WMB’s market cap is $22.4BN, so the GP stake is being valued at $12.8BN ($22.4BN – $9.6BN), or 11.3X next year’s cashflow. This looks cheap compared to other transactions. For example, Marathon (MPL) acquired MarkWest last year at an implied GP multiple of more than twice this, according to figures from Wells Fargo. And our analysis here only assumes GP IDR growth from new projects; it gives no credit to growth from WPZ’s substantial existing asset base. So we think the 13.1% growth rate on the GP IDRs is conservative. In effect, WMB can grow its GP IDR-derived cashflow without having to pay for it.

We think on this basis that WMB is undervalued.

We are invested in WMB.

Controlling Assets Without Buying Them

On Tuesday morning, Enbridge (ENB) and Spectra (SE) revealed how they’d spent the Labor Day weekend by announcing their merger. After the highly contentious and ultimately unconsummated Energy Transfer/Williams soap opera, it was a welcome surprise to see two large energy companies join their businesses agreeably, without rancor.

Although the financial media excitedly covered the union, investors in the Master Limited Partnerships (MLPs) controlled by ENB and SE might well have wondered what’s in it for them. In another demonstration that the General Partner (GP) is where the action is, their long list of affiliated MLPs enjoyed only muted revaluation at best. The combined ENB/SE will control (among others) Spectra Energy Partners (SEP), Enbridge Energy Partners (EEP) and Midcoast Energy Partners (MEP). Yet since control of the MLP lies with the GP rather than the Limited Partners (LPs), there was no need to acquire the MLPs.

Not only did SEP investors not see a bump in their stock price, but SEP’s price fell as the market reflected its greater use as a source of funding for the $26BN combined capex program scheduled 2017-19. One of the MLPs, EEP, has a cap on its Incentive Distribution Rights (IDRs, the fees paid to the GP) of only half the limit set for SEP. This makes it potentially attractive for EEP to be rolled up into SEP where the more generous SEP IDR structure would apply to its cashflows. GPs always have options.

Suppose two big hedge fund managers merged. To avoid any confusion we’ll use fictitious names of two already successful firms, Masters of the Universe (“Masters”) and Kings of the Cosmos (“Kings”). The owners of Masters and Kings would rightly celebrate, since they anticipate many operating efficiencies as well as synergies by working more closely together. Clients of the hedge funds run by Masters and Kings would gamely cheer the union as well, reasoning that a good financial event for the stewards of their capital surely couldn’t actually be bad for the clients, even if no objective evidence supports such warm feelings. Principals from Masters and Kings would reach out to significant clients and explain their new growth strategy as “win-win”, “good for all concerned” and “driven by partnership philosophy.”  In fact, a good rule as an investor is to recognize that when a money manager refers to his clients as “partners” (think hedge funds and private equity) the fees look less partner-like and more wealth-transfer-like.

Masters and Kings will use their now larger aggregate Assets under Management (AUM) to grow their investment strategies to the limits of their capacity and beyond. They’ll rely on the Large Size = Highly Successful = Defensible Decision thought process of new investors and their consultants. The original clients’ misplaced earlier happiness is rewarded with lower returns.

It’s not a perfect analogy. MLP investors are generally treated far better by MLP GPs than are hedge fund and private equity clients. And hedge fund managers rarely merge, although size and performance reliably follow opposite paths.  But the ENB/SE merger is about synergies, faster cashflow growth and stability from diversification. The affiliated MLPs’ main purpose in life is to provide cheap capital to support the GP’s growth plans. A skillful GP generates MLP returns just sufficiently attractive to keep investors returning, but anything in excess is wasteful. When an MLP yield falls from, say, 7% to 5%, the corresponding strong price performance cheers its investors. However, to the GP the resulting low yield on its MLP creates an imperative to cash in by issuing equity cheaply to fund more growth. A GP who allows the yield on his MLP to fall too far is missing an opportunity to issue equity. Investment bankers rarely fail to point this out.

We like the ENB/SE merger, but that’s because we’re invested in ENB and SE rather than any of the affiliated MLPs. We also note that Williams Companies (WMB) continued the rally that followed its escape from the altar with Energy Transfer. The 11.4X Price/Distributable Cash Flow multiple of WMB looks attractive relative to SE’s 25.3X, more so following ENB’s willingness to merge at that valuation.

We are invested in ENB, SE and WMB

blog-september-11-2016-image-v2

MLPs and Crude Oil, the Improbable Dance Partners


Talk about MLPs nowadays and pretty soon you’ll get to crude oil. Few will quickly forget the collapse in crude from 2014 that led to the collapse in MLPs. To be an MLP investor seemingly requires a view on the price of what moves through their infrastructure (although only 7% of pipelines in the U.S. carry oil; natural gas, natural gas liquids and refined products are more dominant).

Since pictures can be more eloquent, we’ve produced some visual insight to the long term relationship between the two. Going back to 1996 (the start of the Alerian Index) crude and MLPs have sometimes moved together and sometimes not. However, an investor who had the foresight to call oil’s sometimes violent but ultimately limp twenty year move from $19.50 a barrel to $43 today might have been dissuaded from buying MLPs. He would have missed a thirteen fold increase in value.

However, we’re not trying to forecast the level of one from the other but their respective returns (forgive me, their first derivatives). How will changes in crude oil affect returns to MLP investors? Both have moved up over twenty years, but not always together as the second chart shows.

And the third chart confirms what we all knew anyway, which is that their returns have become more correlated. In fact, the past couple of years have seen a dramatic shift in the relationship. In June 2014 the correlation was 0.1, which is to say there was effectively no relationship at all. Since then it has tightened to levels last seen in the 2008 financial crisis, when everything apart from government debt was falling.

Having examined the past, what can we conclude going forward? First, correlations tend to mean-revert, and it’s not a big leap to suggest that MLPs and crude oil will decouple to some extent. The three month correlation of daily returns (not pictured here) is more sensitive than the 12 month correlation we’ve used, and it shows that the relationship has weakened in recent weeks.

Another point to note is that correlations across asset classes in general are moving up. Stocks and bonds have both been registering new highs. As MLPs have recovered from their February low they become more highly correlated with both asset classes (although at still 35% off their old August 2014 high a switch from almost anything into MLPs looks attractive). And in fact, MLPs have demonstrated a more meaningful relationship with stocks both recently and over twenty years. So the more pertinent question for the potential MLP investor is to ask where stocks are going, but perhaps that seems both obvious and unanswerable, so attention shifts back to crude.

We think the correlation will come down from current levels. But as U.S. hydrocarbon production increases our economy will gradually enjoy less of a consumption boost when crude oil falls. Traditionally, cheaper gasoline has been regarded as a tax cut, but many economists were surprised at the muted boost to consumption that we saw last year.

We also think the long term outlook for crude oil is positive. $1TN of cuts in drilling budgets through 2020 will make it hard to source new supply needed to offset roughly 5MMB/D of depletion and another 1.0—1.5MMB/D of new demand. We wrote about this recently in Why Oil Could Be Higher for Longer.

It’s perfectly natural for investors to mention crude oil and MLPs in the same breath. But we think the strong recent relationship will weaken, and industry fundamentals will dominate again.


image_pdfimage_print