Filling Up

“Yes, but are the pipes full?”

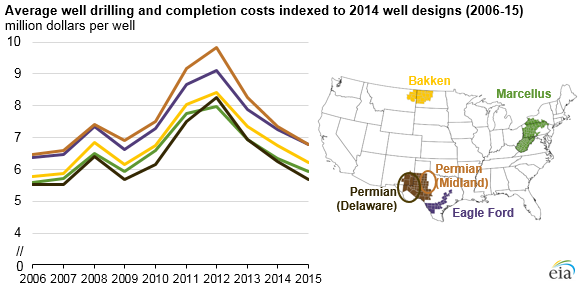
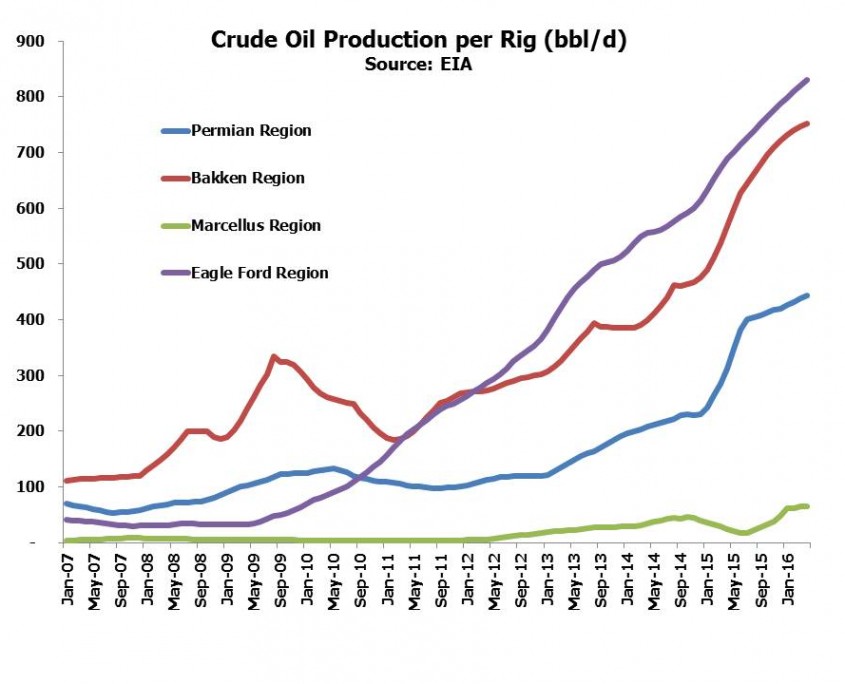
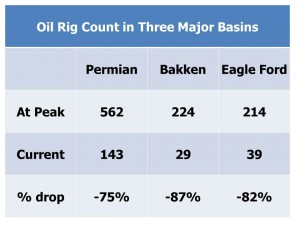
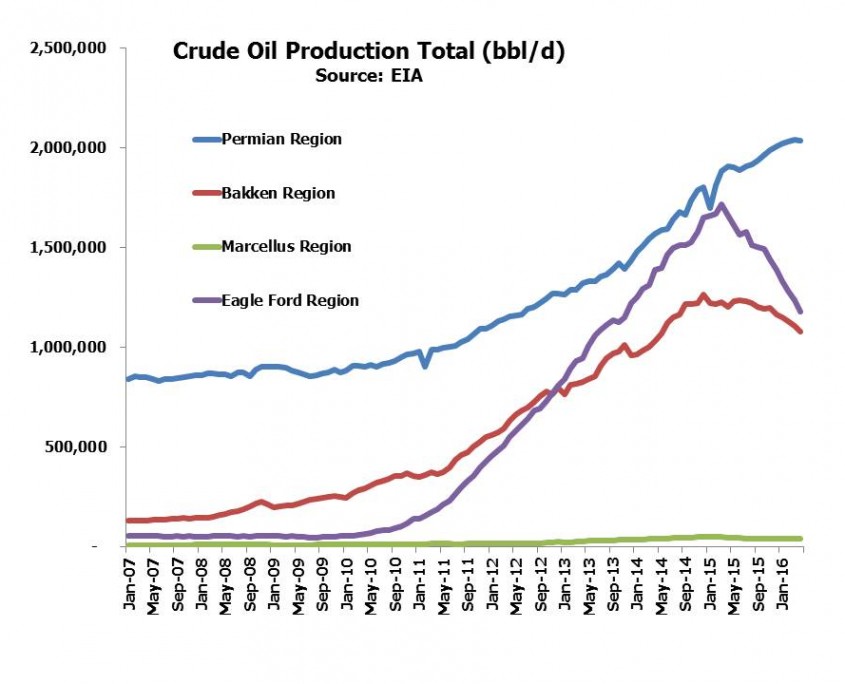
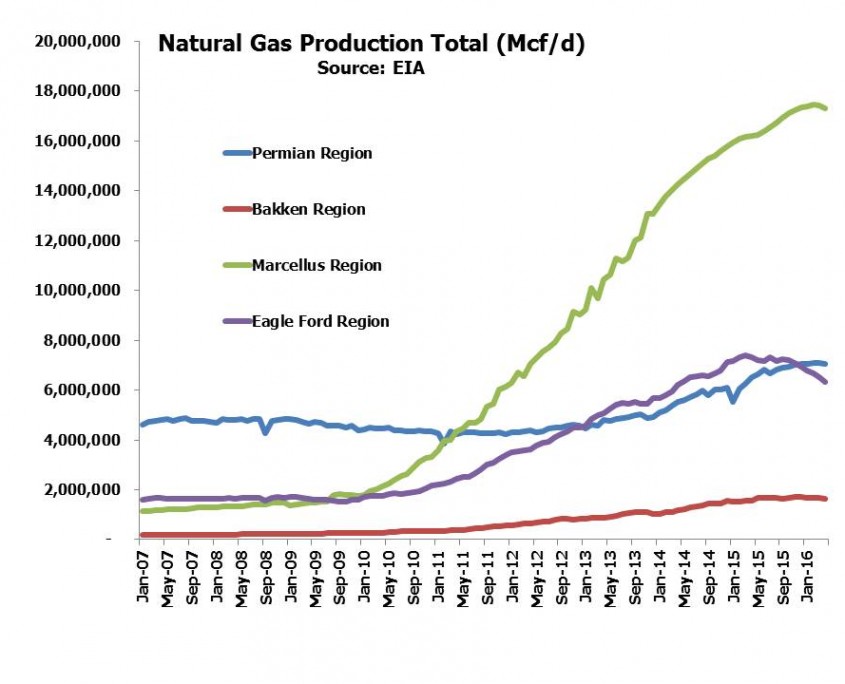
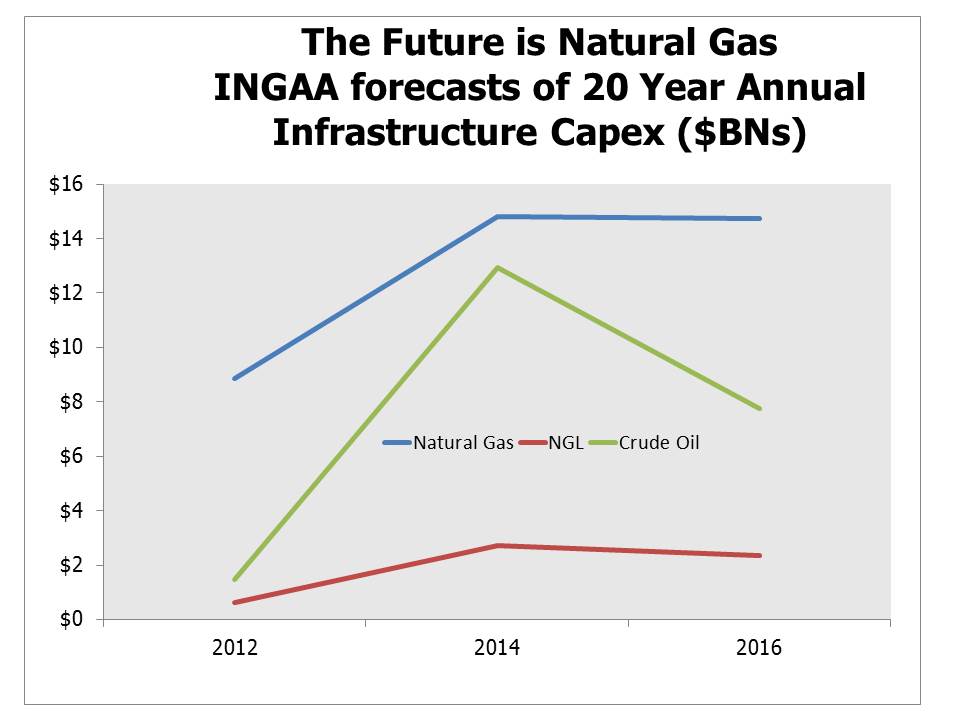
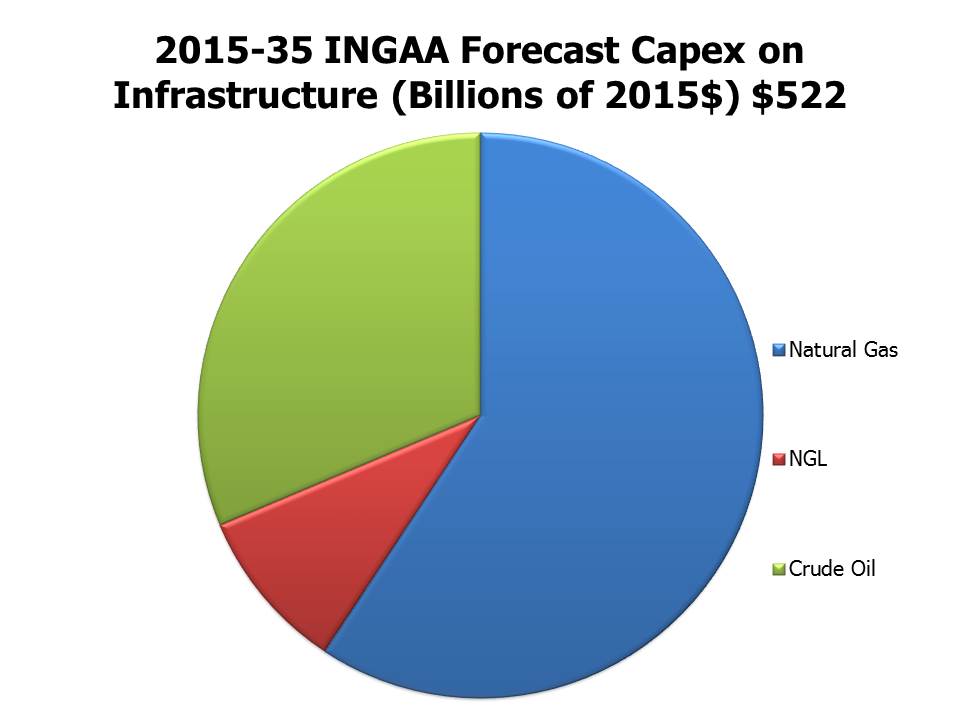
This was the pointed and entirely reasonable question of one investor several weeks ago after hearing that the energy infrastructure sector offered compelling value. It cuts directly to the crux of the issue. You can discuss the sanctity of contracts, stability of cashflows, limited commodity exposure and yet the most fundamental metric about any toll-based business model is how much of its capacity is being used. If you own a bridge you care little about the price of cars but are happy to see heavy traffic passing through your tollbooths. While Master Limited Partnerships (MLPs) never claimed immunity to falling oil and gas prices, high utilization of their assets is unambiguously good.

It would be nice if there was a heat-map of all the pipelines in North America that showed their utilization with different colors. Sadly, no such scoreboard exists and so the view has to be assembled piece by piece. Earnings reports from individual MLPs provide a contemporaneous picture of utilization. Some first quarter reports have already been released and the signs are generally good. NuStar (NS) noted increasing demand for their Eagle Ford pipeline assets which was surprising given weakening output in that play.  Noted shale driller Pioneer Natural Resources (PXD) reported higher than expected crude production with continued declining costs. Some of their horizontal wells extend over 10,000 feet laterally, improving productivity. They now expect production costs in 2016 of $9-11 per barrel of oil equivalent (BOE). In 1Q16 these costs were down 20% on the prior year’s first quarter. They report some wells have operating costs as low as $5-$7 per BOE.

The clearest indication that existing infrastructure is being used is the need for more. For long term supply/demand, a good place to start is with the INGAA Foundation which periodically publishes their view on natural gas, natural gas liquids (NGLs) and crude oil and their corresponding infrastructure requirements. If the pipes/storage facilities/fractionators etc. are generally not fully utilized, the need for new infrastructure will be reduced.INGA Chart 1 Blog April 30 2016

INGAA recently published an updated long term outlook. It’s instructive to link their 2012 and 2014 forecasts with their current one. Forecasting the supply and demand for natural gas, NGLs and crude oil over twenty years is by no means an exact science. Key inputs include economic growth in the U.S. and elsewhere, government policy regarding carbon emissions and, not least, the prices of the underlying hydrocarbons themselves. Like some Exploration and Production (E&P) companies, INGAA found itself swept up in the promise of the shale revolution. From 2012 to 2014 their estimate of new crude oil infrastructure investment jumped by a factor of eight, only to be slashed by 40% in response to the collapse in crude prices.

INGAA’s current forecast of $7.8BN in annual crude oil-related capex is no more likely to be accurate than in the past, heavily dependent as it is on the future price of oil. In 2014 they based their $12.9BN (annual capex figures are all inflation-adjusted to 2016) forecast of annual capex over 20 years on $100 per barrel, and now they’re forecasting an eventual move to $75 by 2025 (the High Case) or by 2030 (the Low Case). Predicting the price of oil is hard. Although some commentators have claimed the U.S. is the swing oil producer with the ability to quickly ramp up production, PXD’s CEO Scott Sheffield highlighted that although  their rig crews could bring a well online in 4-5 months,  it would take the U.S industry two years to meaningfully increase production back up, due to a current focus on bringing down leverage as well as the time it takes to rehire and train workers.
INGA Chart 2 Blog April 30 2016

While the futures market lets you lock in the prices shown for a year or two, futures are a poor forecast of where the market will actually be. The spot price combined with the costs of storage, impacted somewhat by hedging activity, set the futures price. And yet today’s spot price pays little heed to the approximately $350BN of reduced capex by E&P companies globally, the approximately 5% annual depletion of today’s aggregate sources of production, the 1.5MM bbls/day of annual demand growth, or that global spare capacity is near the lowest levels in history.

By contrast with the unpredictability of crude oil prices and the related infrastructure need, the outlook for natural gas has been remarkably stable. INGAA raised their expectations in 2014 and kept them unchanged in 2016. Beneath the figures though there are some substantial shifts. The north east U.S. is becoming a prolific regional exporter of natural gas, which is creating more demand for take-away capacity as well as causing the reversal of transmission pipelines to run from the north east rather than towards. Insufficient takeaway capacity in the Marcellus has hurt producers[1]. Liquid Natural Gas (LNG) exports via seaborne tankers are a growing source of demand, as are exports via pipeline to Mexico. Canadian bitumen-based crude oil production (‘tar-sands’) uses natural gas to heat the bitumen to a semi-liquid state. The long lead times for such projects assure that Canadian crude production will increase.

INGAA went with a High and Low Case forecast in their 2016 release (figures above are based on the midpoint between the two). U.S. energy infrastructure is much more about natural gas and NGLs, with only 7% of pipelines being dedicated to crude oil. Infrastructure doesn’t get built without customers being signed up. Kinder Morgan (KMI) recently shelved their North East Direct (NED) plan to expand natural gas supply and storage to New England because they could only achieve a projected 6% return. A mild winter caused memories of $40 natural gas to fade in Boston (versus $2-$4 per MCF more commonly). While the project would have contributed to growing earnings at KMI, its cancellation shows why natural gas pipelines don’t normally sit unused. We are invested in KMI.

INGAA Cap Ex Forecast Blog April 30 2016

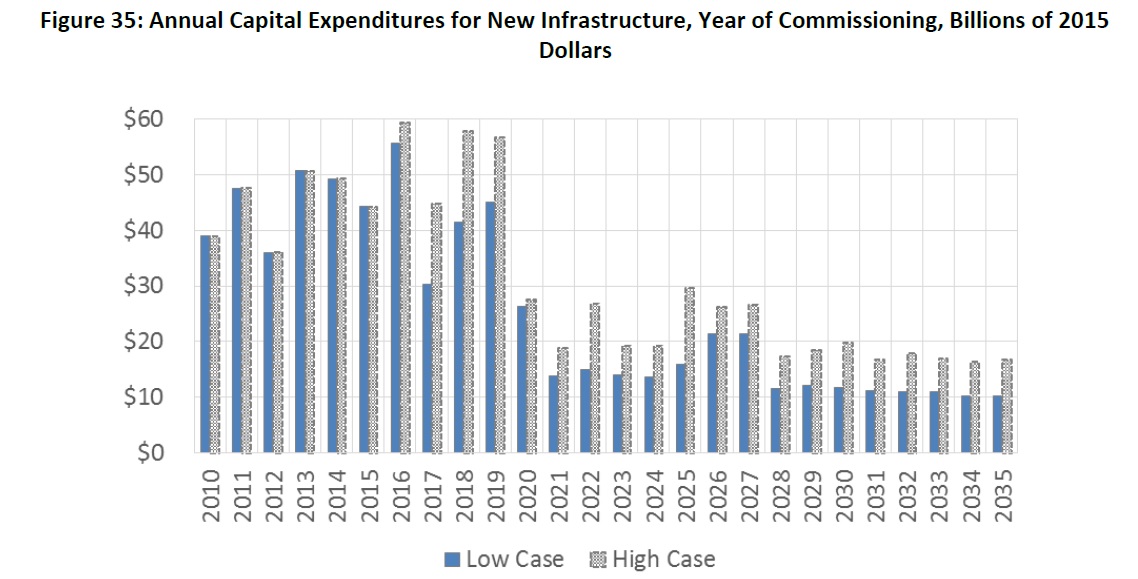
As the chart (from INGAA) showing annual capital expenditure highlights, a good portion of the infrastructure spend is set to occur within the next few years. Many of these projects are already under construction since the data is presented based on the year that a project is completed; a good portion of the capex will have occurred in prior years.

In spite of last year’s MLP collapse, expected U.S. natural gas and NGL output didn’t change much; America’s energy infrastructure continues to be augmented. Moreover, a good part of the spending is occurring over just a few years. As this grows the asset base of MLPs, it will highlight the substantial advantages enjoyed by MLP General Partners (GPs), for at times of asset growth the MLP GP looks like a hedge fund manager. Our investing strategies and fund are designed to exploit this.

[1] North American Midstream Infrastructure Through 2035: Leaning into the Headwinds. INGAA, Pg 36

Williams Companies Stands Alone at the Altar; Crestwood Delevers and Soars

Williams Companies Stands Alone at the Altar

The Energy Transfer-Williams deal continues to be a rich source of intrigue and fascinating machinations. Sometimes a target company will try and get out of an agreement to sell itself so as to join with a more eager suitor. But it’s not often that an acquirer has second thoughts, and reading through a recent SEC filing by Energy Transfer reveals a blow-by-blow account of the frequent discussions of the William board as they considered their options.

As long ago as February 2014, Energy Transfer Equity (ETE) CEO Kelcy Warren had reached out to Williams Companies (WMB) CEO Alan Armstrong to discuss a combination. Armstrong was initially lukewarm and from the looks of it never became enthusiastic, even voting against the combination when it was finally considered by the WMB board in September 2015.

The “Background to the Merger” is in a section of a filing made, ironically, by Energy Transfer Corp (ETC), an entity created specifically to acquire WMB shares at closing but which for now is doing little more than posting SEC filings. Although ETC is currently controlled by ETE, its filing includes a methodical recital of the WMB board’s consideration of ETE’s offer as well as other competing proposals. Indeed, as the negotiations reached a conclusion WMB insisted on severely limiting ETE’s ability to walk away from the transaction. WMB sought to tighten the “material adverse effect” language that is commonly used and which allows a party to cancel a proposed transaction for no penalty in the event that a major surprise upsets the original economics. Kelcy Warren had pursued WMB for almost two years, and having finally succumbed to their eager paramour the WMB board was intent on making the deal stick.

Chart Blog April 24 2016

Buyer’s remorse followed with indecent haste (see The Energy Transfer-Williams Poker Game). Within months ETE’s CFO Jamie Welch was reported to be privately lobbying WMB shareholders to press for modified deal terms, since the $6BN cash payment agreed to by ETE was weighing on the stock price. In fact, the performance of both stocks has been disastrous since the deal was announced, since the new ETC stock with which WMB investors would be paid was to be linked to collapsing ETE, thereby diminishing the value of the sale. It became obvious why ETE wanted out – less clear why WMB insisted on completing a transaction whose value had disintegrated. In May of 2015 ETE’s proposal to WMB had valued the stock at $64. By March of 2016 the prospect of the deal closing had dragged WMB down to $15. By then, Kelcy Warren had fired his CFO (who has sued) and gone nuclear in his efforts to get the deal changed or cancelled; ETE made a possibly illegal and certainly unethical move when they issued preferred equity only to insiders on preferential terms (thus devaluing the currency WMB investors would receive in the transaction, and drawing a WMB lawsuit). In case ETE’s distaste for the transaction wasn’t already clear, they subsequently posted an SEC filing slashing the originally expected $2BN in annual commercial synergies to only $170MM. For good measure they added that the combined company’s presence at WMB’s current headquarters in Tulsa, OK would be substantially reduced.

At this stage both stocks are attractively valued if they remain separate. So it’s interesting to learn how comparatively easy it is for the deal to be broken if the acquirer doesn’t wish to proceed. The merger-arb funds and the journalists who bet on a closing missed this. The New York Times reported on March 4th that, “…the company’s options appear to be severely limited.” With respect to breaking the deal, last week’s S-4 from Energy Transfer Corp noted that their tax counsel might not be able to deliver a needed tax opinion in time, a necessary condition for closing. One can imagine that if the acquirer doesn’t want to proceed, and an affirmative tax opinion is required from its legal counsel, it shouldn’t be difficult to delay or even fail to obtain such an opinion. Originally WMB didn’t want to be bought and ETE gave chase. Having finally been caught, WMB desires consummation while ETE claims its earlier passion has gone. WMB is at the altar while ETE nurses the mother of all hangovers in a hotel. Did they find each other on Match.com? In this upside-down world of love professed, only to be returned unrequited, it must be difficult for WMB to press a damages claim. Since the abovementioned filing cast further doubt on the deal WMB’s stock has risen. In any event, on June 28th either party can simply walk away. For Kelcy Warren that date probably can’t come quickly enough. The next target of his affections may run a little faster.

Crestwood Delevers and Soars

On Thursday Crestwood Equity Partners (CEQP) announced a joint venture with Con Edison which placed a 13X EBITDA multiple on the part of CEQP that was rolled into the JV and allowed them to use cash proceeds from the deal to reduce leverage. It was another example of public market equity prices underpricing the value that other energy sector investors assess to be present. Although CEQP jumped over 50%, we believe it’s still attractively priced with a 14% yield following a distribution cut, 1.6X distribution coverage and leverage dropping to <4X by year end. We noted the potential value in CEQP in February (see The Math of a Distribution-Financed Buyback)

Sell-Side Shockers

Meanwhile, MLPs have since February kicked off the casket lid and leapt up, showing vigorous signs of life. Many formerly wealthy MLP investors who hung on are no doubt relieved to be restored from potential mobile home dwellers to at least the category of mass-affluent. Sell-side coverage of the sector is becoming more cautiously constructive, buoyed by the Alerian Index finally reaching positive territory year-to-date. We came across one amusing recommendation from a clearly overworked analyst whose bosses evidently decided to issue an emergency research piece initiating coverage on MLPs. The hapless analyst breathlessly rates Columbia Pipeline (CPGX) “Market Perform”, failing to consider  TransCanada’s (TRP) recently agreed acquisition of CPGX for $25.50 in an all cash deal. So regardless of how the market performs CPGX is going to $25.50. The same analyst thinks WMB investors will suffer a 50% dividend cut if the merger with Energy Transfer goes through, overlooking the 1.5274X ETE exchange ratio they’ll receive for their WMB shares. Who says sell-side research isn’t worth reading?

We are long CEQP, ETE and WMB in our mutual fund and separately managed accounts.

Chart source: Yahoo Finance

Energy's Winners and Losers

The U.S. Energy Information Agency (EIA) is a powerful resource for those interested in the topic. They recently noted that in 2016, natural gas-fired power generation would exceed coal for the first time in history. 18.7 gigawatts (GW) of new gas-fired capacity is due to come online between now and 2018 replacing dirtier coal plants as they are gradually phased out. Moreover, much of this new capacity is located near its source of energy, so Pennsylvania, West Virginia and Ohio (Marcellus and Utica shales) as well as Texas and Louisiana (Eagle Ford and Haynesville shales) have seen much of this added capacity. The travails of the coal industry are well known, with the bankruptcy filing last week of the world’s biggest coalminer Peabody Coal (BTU) highlighting the economic challenges of producing the dirtiest fossil fuel. Cheap natural gas has long been on course to supplant coal for power generation in the U.S. The EIA’s Annual Energy Outlook 2015 forecasts natural gas to move from 27% to 31% of electricity generation by 2040. Only renewables will also enjoy an increased share, with Nuclear and Coal both slipping in importance.

What’s taking place is a fairly dramatic transformation of the ways in which the U.S. uses energy compared with as recently as five years ago. The unlocking of vast amounts of natural gas has provided very competitively priced power for industry, cheap ethane feedstock for use in the production of plastics and by displacing coal has allowed the U.S. to curb its production of greenhouse gases. This last point is especially ironic since the U.S. never signed up to the Kyoto Protocol, whose goal was to limit emissions of carbon and other pollutants.

Sometimes when chatting with clients about energy consumption and fossil fuels I’m asked why we don’t worry about electric cars and solar power upending the sourcing and consumption of electricity. Electric cars sound clean, but it depends on how the electricity they use is generated. The good news here is that it’s increasingly from relatively clean natural gas although it does vary across the United States. A friend of mine is planning to buy a Tesla, and her environmentally-sensitive decision is supported by the virtual absence of coal-fired electricity production in New York and New Jersey where she’ll be driving. Wyoming may offer spectacular scenery and an environment worth saving, but with 89% of its power coming from coal a Tesla won’t much help the environment there. West Virginia and Kentucky are similar.

EIA Renewables Use Blog April 17 2016

Renewables are expected to gain in importance, going from 13% of our electricity generation to 18% by 2040 according to the EIA as the first chart shows. Solar energy will grow at a fast rate but from a very low base, as is shown in the second chart. It looks to me as if my grandchildren will reach retirement before they inhabit a world in which solar is the dominant source of energy. Although we invest for the long term, that’s too far out even for us to incorporate into our thinking.

EIA Solar Use Blog April 17 2016

Low prices for crude oil and natural gas have also created challenges across many industries beyond their own. For example, the economics of renewables, including solar, have suffered from cheaper competing fossil fuels. SunEdison (SUNE) is close to bankruptcy as it grapples with this problem. Banking hasn’t been immune —  JPMorgan, Wells Fargo and Bank of America all reported higher loan loss reserves against their energy portfolios last week. And last October, somewhat improbably, United Airlines blamed a disappointing quarter on fewer corporate executives flying to visit oil fields; most would think cheaper fuel is good for airlines.

Although last week saw the bankruptcy of the biggest miner of “old” fuel in Peabody and the pending demise of a champion of new energy in SunEdison, Tallgrass Energy (TEP) had a good week. This Master Limited Partnership (MLP) provides natural gas transportation and storage services in the Rockies and Midwest through their Tallgrass and Trailblazer systems. TEP has a publicly traded General Partner (GP) called Tallgrass Energy GP (TEGP), which runs TEP. As is invariably the case, management is invested in TEGP rather than TEP. If you want to invest alongside management in an MLP it usually pays to own the GP instead. In the case of TEGP and TEP, management insiders have around $1.9BN invested in the GP and only 18MM in TEP itself, a difference of 101X. They obviously have an opinion about the relative merits of these two securities. Last week, TEGP raised its quarterly distribution by 21.4% compared to the previous quarter. Not every part of the energy sector is struggling.

We are invested in TEGP

Drilling Efficiencies, Crestwood and More Energy Transfer-Williams Shenanigans

Drilling Efficiencies

A week or so ago the Energy Information Agency (EIA) released the results of a survey showing the average cost to drill and complete a well in four of the major producing regions in the U.S. As the EIA chart shows, costs were rising going into 2012, but thereafter started to fall and maintained that trajectory as exploration and production companies aggressively sought improved efficiency from their technology and their service providers. EIA Well Cost Chart Blog April 10 2016


Although this drop in well costs has obviously been good news for the E&P industry (albeit less so for their service providers) it has been complemented by greater output per well. Using data from the EIA’s Drilling Production Report we have created the four subsequent charts, showing, respectively, output per rig for crude oil and natural gas, and total production of crude oil and natural gas, for each of the four regions highlighted by the EIA.  Reduced costs to complete a well might accommodate lower average production per well, but in fact the reverse has generally been happening which has allowed IRRs (Internal Rates of Return) to remain substantially more attractive than would otherwise have been the case.April 10 Blog Crude Production by Rig Chart

Natural gas production efficiency has improved dramatically in the Marcellus, which has caused the north east U.S. to switch from being a natural gas importer to an exporter and has begun to displace supplies from eastern Canada.

This is why crude oil and natural gas production have only fallen appreciably in the Eagle Ford, where higher initial production rates of new wells (due to higher pressure) are more than offset by faster decline rates than in other regions.

Oil Rig Count April 10 Blog

Natural gas output has soared in the Marcellus, aided by falling costs and a more than five-fold increase in output per rig since 2010. And meanwhile the rig count has come down sharply, as the table shows (Source:EIA).

This all represents a fantastic example of American technological innovation rapidly responding to the collapse in crude oil, probably faster than most observers had any reason to expect. Who would want to bet against continued American advances and improvements in this sphere?

April 10 Blog Crude Total Production Chart


April 10 Blog Nat Gas Total Production Chart

Crestwood

A couple of months ago we wrote about Crestwood Equity Partners (CEQP), in The Math of a Distribution-Financed Buyback. Quicksilver is a bankrupt E&P company that had asked the bankruptcy court to reject Crestwood’s contract to provide gathering and processing services. There isn’t much case history of courts resolving contractual disputes between MLPs and their customers, but the travails of many domesric drillers has certainly drawn attention to this aspect of the MLP business model.

On Wednesday, Crestwood announced they had signed a ten year agreement to provide such services to BlueStone Natural Resources, the acquirer of Quicksilver’s Barnett Shale acreage. Previously shut-in wells will be re-opened and the contract, which consists of both fixed-fee and percent of proceeds terms, commits BlueStone to refrain from constraining production for economic reasons through the end of 2018.

It’s just one contract out of tens of thousands across the industry, but its constructive resolution highlights the symbiotic relationship between E&P companies and their infrastructure providers.


Energy Transfer and Williams

Last week we wrote about the Energy Transfer-Williams Poker Game  and further twists in the plot took place since then as Williams (WMB) sued Energy Transfer (ETE) and CEO Kelcy Warren for violating the merger agreement when they issued convertible securities only to ETE management. There are no sympathetic characters here, but one can already hear the WMB lawyer explaining in court that WMB initially rejected ETE’s overtures, then finally agreed and is simply seeking to close the transaction on the agreed upon terms. Or, ETE pursued WMB in spite of being rejected, finally got the deal they wanted and have now changed their minds.

I guess Kelcy Warren has  earned the right to blunder; while it’s impossible to forecast a resolution, it’s becoming a little hard to envisage a happy combination of these two companies under present circumstances. The uncertainty represents a substantial pall over both stock prices; a grudging break-up payment from ETE to WMB might well be the outcome that lets both managements focus on their operating businesses and brings this sorry, absorbing episode to a conclusion.

One solution that distribution loving MLP investors will find almost unbearable to even ponder is for ETE to scrap the preferred offering, close the deal per the original agreement and suspend the distribution. With $4BN a year in cash flow at the pro-forma parent the $6BN cash payout would be retired in a year and a half with investors looking at a combined company trading at 3x cash flow with conservative leverage.

We are long CEQP, ETE and WMB.

The Energy Transfer-Williams Poker Game

The managements of Energy Transfer Equity (ETE) and Williams Companies (WMB) are engaged in a high stakes poker game. It’s an absorbing spectacle. Last May WMB announced plans to buy in its MLP Williams Partners (WPZ). As with Kinder Morgan, they felt their size as well as the drag from Incentive Distribution Rights (IDR) from WPZ to WMB was making it hard to identify accretive growth projects. Kelcy Warren, ETE’s CEO, made an unsolicited offer for WMB and after fending him off for several months WMB eventually agreed, grudgingly, to be acquired in September. They dropped their earlier plan to merge with their MLP.

Almost immediately ETE was struck with buyer’s remorse. The deal terms included an $8.10 cash payment from ETE for each WMB share, and as MLPs sank this $6BN payout represented an increasing percentage of the deal as well as an unneeded strain on ETE’s balance sheet. ETE had crafted a complex transaction. They were keen to maintain the GP/MLP structure, since Kelcy Warren clearly recognizes the value in an MLP GP (see Energy Transfer’s Kelcy Warren Thinks Like a Hedge Fund Manager). However, ETE couldn’t simply issue new units to exchange for WMB shares to satisfy the non-cash component, because ETE is a partnership that generates a K-1 and WMB shareholders wouldn’t want to exchange their shares in a corporation generating a 1099 for LP units. So ETE agreed to exchange 1.5274 shares in the newly formed Energy Transfer Corp (ETC) for each WMB share.

ETC is supposed to track ETE for two years following the transaction close through a mechanism designed for the purpose, but it’s a novel approach and it’s unclear how they’ll both trade after that. The complexity shows how keen Kelcy Waren was to buy WMB and so retain their MLP as a stand-alone vehicle still generating IDRs for its GP. But as ETE, WMB and MLPs generally fell, ETE’s CFO Jamie Welch apparently began looking for modifications or even a way out of the deal without having to pay a break-up fee. In fact, Jamie was visible in telling WMB shareholders they should reject the transaction, and last month he was fired.

Whether Jamie was fired because he crafted a poor deal or because he was using the wrong strategy to change it, Kelcy Warren soon went on the offensive. In quick succession ETE announced two transactions designed to make ETE and its doppelganger ETC less valuable by enriching senior management at the expense of other ETE/ETC shareholders including, should the transaction close, WMB shareholders.

On March 10th Energy Transfer announced a limited offering of convertible units available only to insiders and on preferential terms. They followed this up with a substantial grant of new shares by way of compensation to ETE management to take effect after the closing of the WMB transaction. Both moves served to make ETE/ETC a less valuable currency to WMB shareholders, but the collateral damage was to all the existing non-insider owners of ETE. The clear message to WMB’s board is, sit down with us and renegotiate this deal or we’ll make it progressively less attractive to you.

What was unsaid publicly was no doubt communicated clearly in private; these terms stink and if you disagree we’ll make them worse. If WMB walks away they have to pay ETE a 1.5BN break-up fee, unless it’s voted down by WMB shareholders. If both companies agree to break up, ETE has to pay WMB $410MM, the same fee WMB had to pay WPZ when that deal was cancelled. There is no provision for ETE to walk away, so they’d likely face  a lawsuit for substantial damages if they did. Considering the deal originally valued WMB at $43.50 compared to its Friday close of $15.52, you’d think pursuing such a lawsuit would be challenging. More recently, to confirm what a bad idea the merger was, ETE took its earlier forecast of $2BN in annual synergies down to roughly zero.

Apparently the WMB board never was that enthusiastic about the deal in the first place, with CEO Alan Armstrong opposed while activist hedge fund manager Keith Meister was in favor.

Kelcy Warren has become a billionaire through the Energy Transfer family of businesses which he founded in 1995. The deal’s proponents on WMB’s board, including Keith Meister of Corvex, are struggling to show that their earlier advocacy was astute given the subsequent collapse in both stock prices. These billionaires now rather resemble elephants dancing in a cramped tea room; the question for investors is how to avoid being the crushed china set in the process, for both men hew to their fiduciary obligations only as long as more important considerations don’t intervene.

Two years ago Keith Meister showed his true colors with alarm company ADT, when in April 2014 he relied upon a stock buyback for which he’d advocated to sell his big ADT position back to the company. ADT’s stock price subsequently sank 30%. ADT’s CEO Nareen Gursahaney was shown to be inept (see ADT and the Ham Sandwich Test) while Keith Meister created further obstacles for those who believe all hedge fund managers are misunderstood altruists.

So ETE’s strategy is one of devaluing its acquisition currency to the point that it’s unattractive, while WMB’s is one of holding out presumably in the hope of a big break-up fee. And yet, since what’s good for ETE must be good for WMB, it’s obvious that there’s a shared interest in reducing the cash portion of the deal in exchange for more equity. The outline of an agreement is clear to everybody, but so far a WMB board that was split and an ETE management that has completely changed its mind cannot put their egos aside and find common ground. It’s mostly about the capital structure of the combined entity. If they get that right both sides will win. But it also shows that there’s more than one way to handle the funds of public shareholders. Few players in this story are showing themselves to be responsible stewards of client capital. In years to come, situations like this will beg the question: how would Buffett have handled it. Whatever the answer, it won’t be like this.

We are invested in ETE and WMB.


image_pdfimage_print