Bond Yields Reach Another Milestone

Recently, an important threshold was breached in terms of relative valuation between stocks and bonds. The yield on ten year U.S. treasuries drifted below the dividend yield on the S&P 500. It’s happened a couple of times in recent years but only because of a flight to quality and never for very long. This time looks different.

It’s worth examining  this relationship over a very long period of time. The chart below goes back to 1871 and reminds us that for decades stock dividends were regarded as risky and uncertain. Little attention was paid to the possibility of dividend growth, and investors clearly placed greater value on the security of coupon payments from bonds.

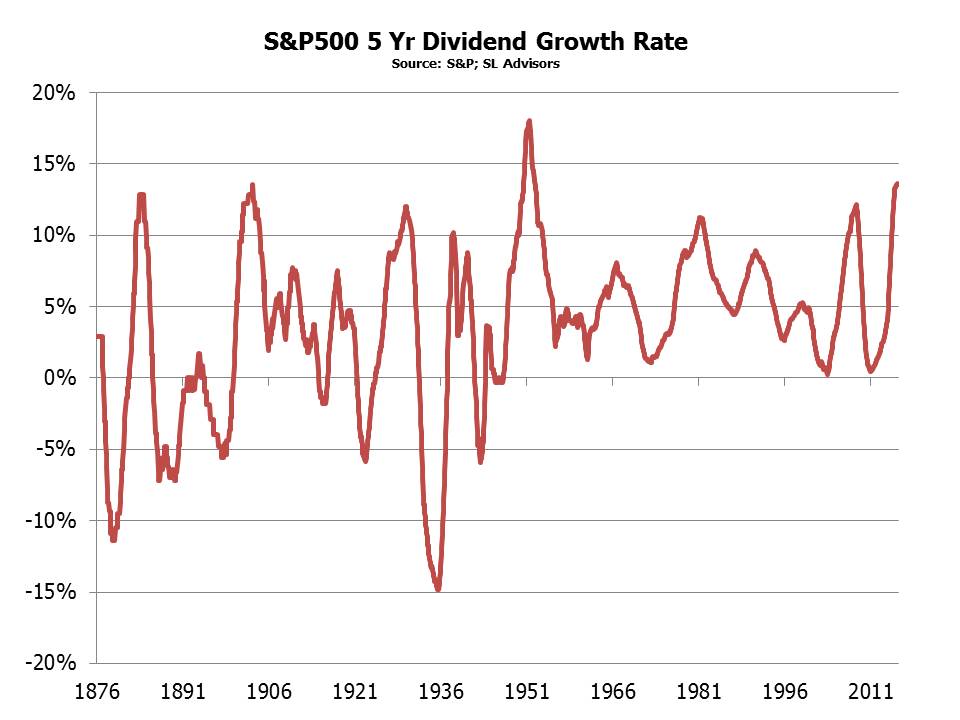
This spread began to reverse in the late 1950s and since then, during the careers of a substantial percentage of today’s investors, bond yields have remained the higher of the two. Dividend growth (defined as the trailing five year annualized growth rate) was more variable prior to the 1950s with several periods when it was negative, so it’s understandable that investors of the day regarded dividends as quite uncertain. However, since the S&P500 dividend yield dipped below treasury yields, dividend growth has never been negative. The five year annualized growth rate since 1960 is 5.8%. Assessing a long term return target for equities is inevitably a combination of art and science, but adding a 5% growth rate to today’s 2% dividend yield suggests 7% is a defensible assumed return.S&P Yield Minus 10 Yr Treasury Oct 23 2015

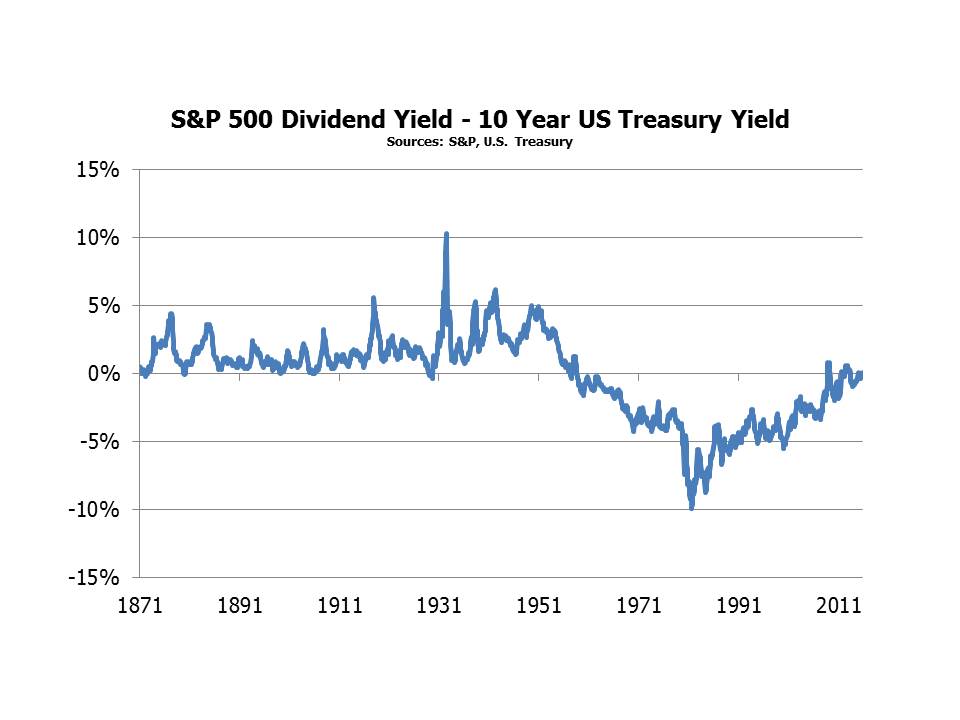
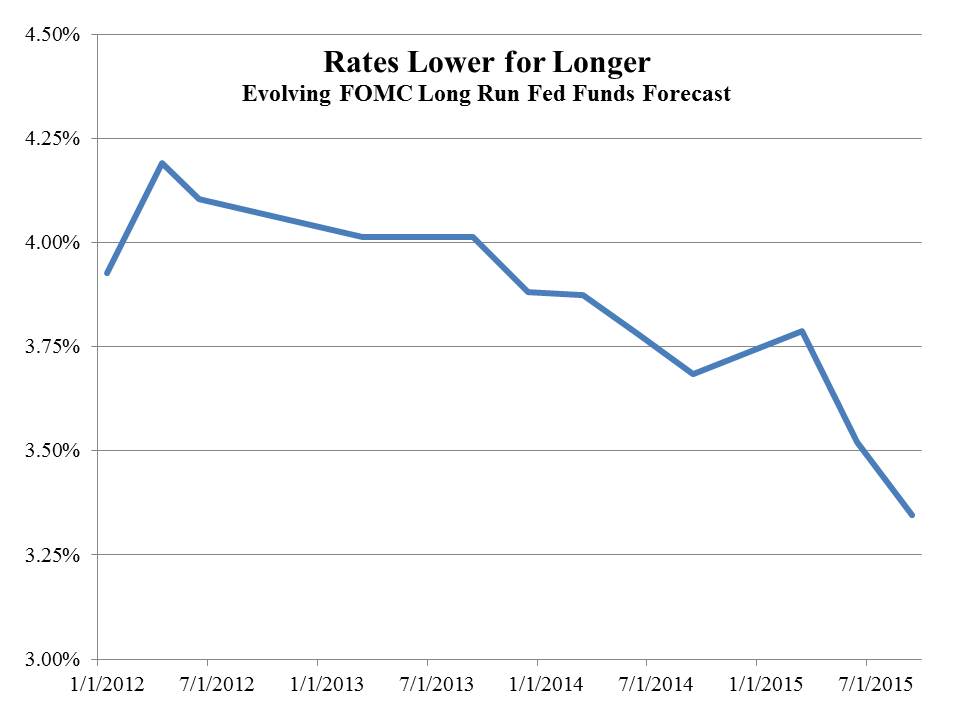
The trend of bond yields to decline towards dividend yields began a long time ago – back in 1981 when interest rates and inflation were peaking. It’s taken over 30 years, but the relationship is now back where it was during the Korean War. The investment outlook is, as always, uncertain with multiple areas of concern. However, the Federal Open Market Committee has made it abundantly clear that rates will rise slowly; recent earnings reports from Coke (KO), Dow Chemical (DOW), Microsoft (MSFT) and Amazon (AMZN) have all been good. These and many other stocks are near 52-week highs and in some cases all-time highs. FactSet projects earnings and dividends to grow mid to high single digits over the next year. These considerations are once again highlighting the inadequacy of fixed return securities as a source of after-tax real returns, and with one major asset class devoid of any value investors are again turning to stocks. The tumultuous markets of late August and September are receding; rather than portending a coming economic collapse, they simply represent additional evidence that far too much capital employs leverage.

S&P Dividend Growth Rate October 23 2015

The long term trend suggests that treasury yields will remain below dividend yields for the foreseeable future. We’re not forecasting such, simply noting that a 2% yield that is likely to grow on a diversified portfolio of stocks looks a whole lot more attractive than a 2% yield that’s fixed. It didn’t look so smart in recent weeks, but if you don’t use leverage and restrict yourself to companies with strong balance sheets you can watch such shenanigans from the sidelines.

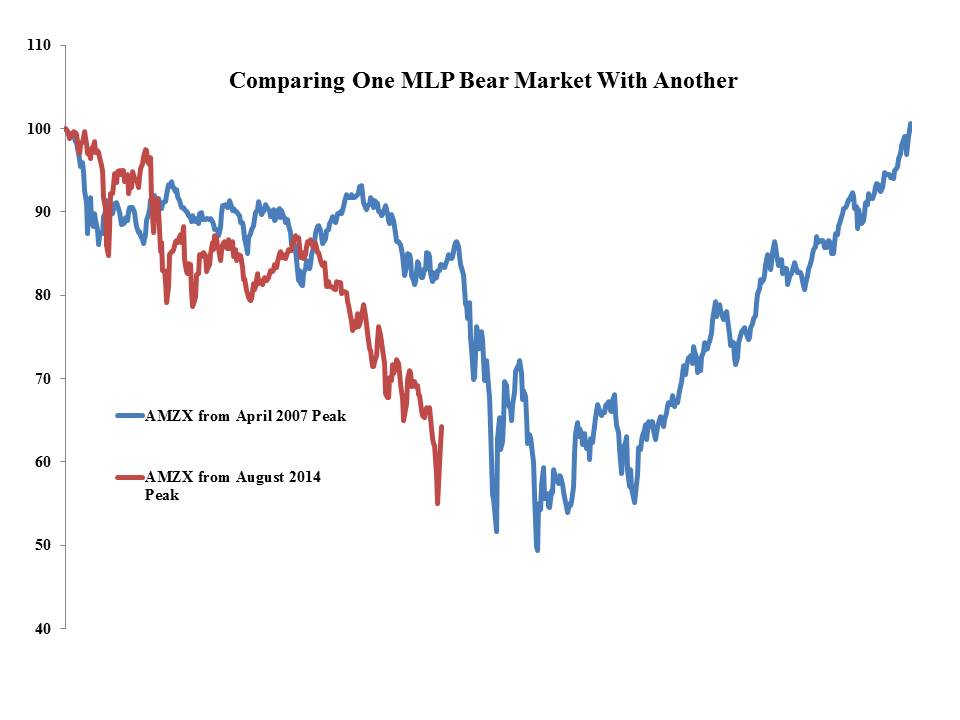
Master Limited Partnerships (MLPs) have begun reporting earnings. Kinder Morgan (KMI) disappointed investors by trimming their 2016 dividend growth from 10% to 6-10%. KMI isn’t technically an MLP any more since they reorganized into a C-corp last year. However, they are squarely in the energy infrastructure business like midstream MLPs. Rather than issue equity to fund their growth projects, they plan to access an alternate, not yet disclosed source of capital through the middle of next year. Their free cashflow covers their distribution, and they access the capital markets to finance growth.

MLPs have had a torrid year, with the sector down far more (in our view) than lower crude oil would justify. As Rich Kinder said, “…we are insulated from the direct and indirect impacts of very low commodity environment, but we are not immune.” KMI owns pipelines and terminals; 54% of their cashflows come from natural gas pipelines; 11% come from a CO2 business that supports oil production; they transport about a third of the natural gas consumed in the U.S. 96% of their cashflows are fee-based or hedged: “insulated…but not immune”.

Selling energy infrastructure stocks is fashionable, and owning them is not. While bond yields are dipping below the S&P’s 2% dividend yield, KMI yields more than three times as much (7.25% on its 2016 dividend assuming the low end of the 6-10% growth range) and its dividend will grow at least as fast. Owning such securities will once more be fashionable.

We are invested in KO, DOW and KMI.

A Hedge Fund Manager Trading At A High Yield

Many years ago, in a different investing climate and a different decade, a cut in interest rates was usually regarded as a stimulative move by the Federal Reserve. Lower financing costs were regarded as helping the economy more than hurting it. They certainly help the U.S. Federal Government, as the world’s biggest borrower. The amount of treasury bills issued at a 0% interest rate recently reached a cumulative $1 trillion. Although declining interest rates adjust the return on lending in favor of the borrower and at the expense of the lender, a lower cost of capital stimulates more borrowing for more investment and consequently boosts demand. However, the intoxicating nectar of ultra-low rates is gradually losing its potency, and while it’s overstating the case to say that markets would cheer higher rates, certain sectors would and the confirmation of an economy robust enough to prosper without “extraordinary accommodation” as the Fed puts it would be novel to say the least.

Several major banks released their quarterly earnings over the past week. Balance sheets continue to strengthen, but another less welcome trend was the continued pressure low interest rates are imposing on income statements. Deutsche Bank expects most major banks to report declining Net Interest Margins (NIMs) as older, higher yielding investments mature and are replaced with securities at lower, current rates. JPMorgan expects to make further operating expense reductions since quarterly earnings were lower than expected.

It’s a problem facing millions of investors. The timing of a normalization of interest rates, which is to say an increase, is both closely watched and yet seemingly never closer. If you look hard enough you can always find a reason to delay a hike, and the Yellen Federal Open Market Committee (FOMC) looks everywhere. Recent speeches by two FOMC members suggest a December decision to hike may not receive unanimous support. The FOMC’s long run rate forecasts continue to drop, as shown in this chart (source: FOMC).FOMC Rate Forecast Sept 2015

Income seeking investors are unlikely to find much solace in the bond market. As I wrote in Bonds Are Not Forever, when rates are punitively low, discerning investors take their money elsewhere.

Suppose you could buy equity in a hedge fund manager, a fanciful suggestion because they’re virtually all privately held. But suppose just for a moment that such a security existed. The question is, how should you value this investment? What multiple of fees to the manager would you be willing to pay or in other words what yield would entice you into this investment?

Hedge fund managers don’t need much in assets beyond working capital and office equipment; the assets they care about sit in the hedge fund they control. So let’s consider a hedge fund manager’s balance sheet which consists mostly of a small investment in its hedge fund, representing a portion of the hedge fund’s total assets, and a bit of cash. It has virtually no debt. Our hedge fund manager earns income from its hedge fund investment, as well as a payment for managing all of the other assets that sit in the hedge fund. These two revenue streams are roughly equal today and constitute 100% of the hedge fund manager’s revenue. The fees charged by the hedge fund manager for overseeing the hedge fund aren’t the familiar “2 & 20”, but are instead are currently 13% of the free cash flow generated by those assets and 25% of all incremental cash flows going forward. Moreover, the equity capital in the hedge fund is permanent capital, which is to say that investors can exit by selling their interests to someone else but cannot expect to redeem from the hedge fund. Meanwhile, our hedge fund manager can decide to grow his hedge fund and thereby his fee stream for managing its assets by directing the hedge fund to raise new capital from investors. This represents substantial optionality to grow when it suits the manager by using Other People’s Money (OPM). This hedge fund’s assets are not other securities but physical assets such as crude oil terminals, storage facilities and pipelines. The hedge fund is returning 9% and is expected to grow its returns by 4+% annually over the next few years.

The hedge fund manager in this example is publicly traded NuStar GP Holdings, LLC (symblol: NSH), the General Partner (GP) for NuStar Energy, LP (symbol: NS). NSH, by virtue of being the GP of NS and receiving Incentive Distribution Rights (IDRs) equal to roughly 25% of NS’s incremental free cash flow, is compensated like a hedge fund manager. NS, a midstream MLP,  is like a hedge fund, albeit the good kind with far more reliable prospects and greater visibility than the more prosaic kind, whose returns have generally remained poor since I predicted as much in The Hedge Fund Mirage four years ago. To return to our question: at what yield would you buy this hedge fund manager’s “fees”, given its option to increase the size of its hedge fund, the hedge fund’s respectable and growing return, the permanence of its capital and the perpetual nature of its substantial claim to the hedge fund’s free cash flow? NSH currently yields 7.6% which should increase ~10% annually over the next several years based on the company’s capex guidance at NS.

We are invested in NSH.

Hedge Fund Manager Runs Drug Company…

In time we may all owe a debt of thanks to Martin Shkreli, CEO of Turing Pharmaceuticals and a former hedge fund manager. Their 5,456% increase in Daraprim brought attention to the the importance of regular price hikes in driving revenue growth at major drug companies. The Wall Street Journal later noted that almost 80% of the increase in the top line for the manufacturers of 30 top-selling drugs came from raising prices versus increasing volumes. It strikes me that this may just become a political issue in the U.S., especially heading into an election year. High drug prices affect millions of Americans and it’s easy for the media to find some poor individual whose needed medication has suddenly tripled in price. Hilary Clinton’s infamous “price gouging” tweet shows that the issue easily lends itself to sound bites, a necessary condition to retain media interest. Big pharma represents a fairly easy target. Congressional hearings no doubt loom for companies such as Valeant (VRX), whose business model relies on testing the limits of the market’s acceptance for price hikes. They operate as a ruthless capitalist in a market where the laws of economics routinely fail, since customers (patients) are rarely informed buyers and typically incur the expense not directly through paying the asking price, but indirectly through consequently higher health insurance premiums or ultimately higher taxes. One friend told me he holds an investment in health care stocks as a hedge against rising medical expenses for him and his wife, an unusual yet insightful approach.

A common refrain from drug companies  is that high drug prices (and the relatively unregulated U.S. market has the highest) allow money to be reinvested back into R&D. This is a weak argument. If research has a high enough IRR, it can be funded through capital from the public and private markets; it doesn’t have to be through retained earnings. It’s just as likely that the ability to charge whatever they can dramatically increases the IRR on R&D. High drug prices themselves makes the R&D more worthwhile than it would be otherwise.

We don’t invest in healthcare stocks, as might be apparent. Therefore, to the extent we run investment strategies that are benchmarked against the S&P500, we are effectively short the health care sector, which has outperformed the S&P500 for the last three years and remains on pace to do so again in 2015.  The issue of drug pricing isn’t likely to recede soon though, and maybe health care stocks will start receiving some of the opprobrium so routinely heaped on banks and oil companies. The energy sector is due for a break as most out of favor.

Martin Shkreli used to work at a hedge fund, and he would probably like the economics of the General Partner (GP) in the MLP sector too. Targa Resources Partners (NGLS) is an MLP whose business is divided between the midstream activities of Gathering and Processing (G&P) of crude oil and natural gas across the central U.S., and downstream activities of Marketing and Distribution. NGLS recently provided guidance for 2016 that included flat distribution growth, reflecting the more challenging environment for some energy infrastructure businesses. However, as the hedge fund is to the hedge fund manager, so is NGLS to Targa Resource Corp (TRGP), the GP of NGLS. The same guidance projected 15% dividend growth at TRGP. Flat returns for hedge fund clients rarely hurt the hedge fund manager, and so it is at TRGP whose Incentive Distribution Rights (IDRs) are at the 50% level, entitling it to half the Distributable Cash Flow from NGLS, the MLP it controls through its ownership of the GP and IDRs. TRGP currently yields  6.3% on its forecast $4.12 2016 dividend, and with a market cap of $3.7BN is of sufficiently modest size to be of interest to many potential acquirers.

We are invested in TRGP.

Why MLPs Did What They Did in September


In September Master Limited Partnerships had a tumultuous month. On September 29th, one day before month’s end, we were looking at the worst monthly performance in the history of the Alerian Index. A strong recovery on the 30th reduced the damage somewhat, but MLPs have had a terrible year and September was nonetheless awful.

Why the market did what it did is far and away the most common question we receive. We’re not market timers and so don’t devote much effort to figuring out near term direction. But people want to know, and we’ve developed a narrative that we think explains recent sharp moves.

Regular readers of this blog are used to me attempting different ways to say the same thing, which is that MLPs are cheap. In September they became cheaper still. If you need reminding of the case, you might peruse recent posts such as Why MLPs Make a Great Christmas Present, Listen to What the Oil Price is Saying, or MLPs Now Look Attractive Relative to Equities. The Alerian Index yields 8%. The case remains, even while prices have dropped. On Thursday, Enterprise Products Partners (EPD), a $72BN enterprise value midstream MLP with significant crude oil and Natural Gas Liquids business, declared a $0.385 quarterly dividend. This represented a 5.5% year-on-year increase and their 54th distribution increase since going public in 1998. It yields 5.56%.

Our Separately Managed Account (SMA) clients remain steadfast, and we have seen inflows from existing and new clients in recent months. Mutual fund clients vary a little more. Many are long term investors focused on understanding the fundamentals and therefore unwilling to let market fluctuations shake them unless supported by altered business conditions. But some do rely on recent price movements to support their conviction, or put another way lose confidence when prices are falling.

It’s clear in the many quarterly account reviews with clients for which Financial Advisors (FAs) are preparing. The third quarter hasn’t been pretty for investors generally; MLPs simply represent the more extreme type of adversity being faced. Some $60BN in mutual funds, ETFs, ETNs and closed end funds exist to provide MLP exposure to retail investors without those dreaded K-1s. Not all these funds are poorly structured, but many are. Owning MLPs via a C-corp structure offers the desired exposure with the simpler 1099 tax form, albeit with the highly unattractive feature of a 35% corporate tax liability (see The Sky High Expenses of MLP Funds).

Expense ratios of as high as 9% are somehow an acceptable price for the K-1 averse would-be MLP investor. The 35% tax roughly means you get 65% of the return. It’s therefore reasonable to assume that the holders of such securities, or the FAs who select them on their client’s behalf, are not the most discerning investors. It’s unlikely they spend much time examining the underlying holdings and their distribution yields, growth rates and capex plans. These are the investors for whom investment analysis begins and probably ends with a price chart. Year-to-date performance for 2015 that was by September 29th -35%, close to equaling 2008’s -36.9%, was challenging for a great many of these.

Fund flows have clearly been negative, supporting the notion that fund sellers have been an important factor in recent weakness. Barrons noted that closed end funds were forced to sell because they were hitting their leverage limits, an example of the stupidity of investing with borrowed money whether you’ve done so directly or through your choice of fund. Moreover, indiscriminate selling of MLPs across the sector bore out the wholesale exit by a certain class of holder. Some writers inferred the market’s rejection of Energy Transfer Equity’s (ETE) acquisition of Williams Companies (WMB) when it was finally announced on the morning of Monday, September 28th. But there was very little new in the ultimate transaction that wasn’t already widely known the Friday before. So why was Energy Transfer Partners (ETP) down 6.5% on Monday? All that changed was that ETP would now be able to connect its pipeline network in useful places to the WMB network. ETP isn’t otherwise involved in the transaction, controlled as it is by its GP, ETE. We are invested in EPD, ETE and WMB.

We think there are a couple of other explanations. One is that the Deferred Tax Liability (DTL) on many of the poorly structured MLP funds came close to flipping signs, as unrealized gains evaporated with a market that had wiped out three years’ prior returns. The consequence of a taxable MLP fund moving from an unrealized taxable gain to an unrealized taxable loss is that they no longer have a DTL. Its mirror, a Deferred Tax Asset (DTA), which might be expected to act like a net operating loss in that it creates a potential future tax benefit, can’t exist for open-ended funds. Hence the Alerian ETF (AMLP) began offsetting its DTA with an equal but opposite “Valuation Allowance”. It’s likely that most if not all taxable MLP funds could be shown to have reached this state, if they published such figures on a daily basis like AMLP. Taxable MLP funds that cross from a DTL to a DTA expose their holders to 100% of the downside (since there’s no longer a DTL cushion) but only 65% of the upside (since gains remain  taxable). Some of these funds started showing daily returns equal to the index on down days, a truly unpleasant asymmetry for many investors, and no doubt an additional inducement to sell for those paying attention.

Many FAs we’ve talked to have been concerned about upcoming quarterly account reviews with clients, since although MLPs had a terrible quarter many other sectors were weak as well. September 29th was the last day when you could sell an underperforming fund so as to keep it off the quarter-end client statement. Discussing a tough quarter can be easier if the offending investments are no longer in the client’s portfolio. The market certainly behaved as if indiscriminate selling climaxed on that day. If MLPs were private and investors had to form opinions by studying their financial statements instead of looking at a stock chart, there wouldn’t be much of a story.

The chart below compares the Alerian Index from its peak preceding the 2008 Crash with its current path from the August 2014 peak. We’ve come down a long way.

MLPs Comparing Bear Markets V2

image_pdfimage_print