Why MLPs Make a Great Christmas Present

Using such a cheery headline following the week MLPs have had will tempt wisecracks that Christmas tree baubles might be better investments than MLPs. Nonetheless, your blogger is looking beyond the latest round of forced selling and taking the longer-term view on returns. It is likely that buyers better understand the values they are getting than sellers do the values they are rejecting. Midstream MLPs with little or no crude oil exposure have seen their equity prices fall. Even StonMore (STON) an MLP in the “deathcare” business, has revealed unexpected linkage between WTI crude and dying. It is in any case hard to explain recent moves beyond noting that sellers evidently seized their task with greater urgency than buyers.

Seasonal patterns in financial markets can draw great interest. The January effect in stocks is well known if less commonly experienced; other folklore includes the adage to avoid selling on Mondays (presumably because a weekend of stressing over a poor investment induces action as soon as possible). As is often the case with statistics, identifying correlation without causality will part many a superficial investor from his capital. There needs to be an economic explanation for an effect for it to mean anything.

Many investors plan their allocations around year-end, but this is especially so for retail investors for whom Christmas offers some time to contemplate finances while recovering from an excess of merriment and (perhaps) family togetherness. Master Limited Partnerships (MLPs) remain widely held by individuals; hence the seasonal pattern they exhibit is both valid and pronounced.

A dilemma for investors is approaching. As we close in on only the second worst year in the history of the Alerian Index (since January 1996), do they forget the pain so far and add, or lick their wounds and wait. The average monthly return on the Alerian Index is 1.17%, although 2015 provided numerous results inferior to that. November is seasonally the worst month, with an average return of -1.0%. December tends to be average, but January averages +4.3%. On average, being invested only for the two months of December and January provides over a third of the annual return
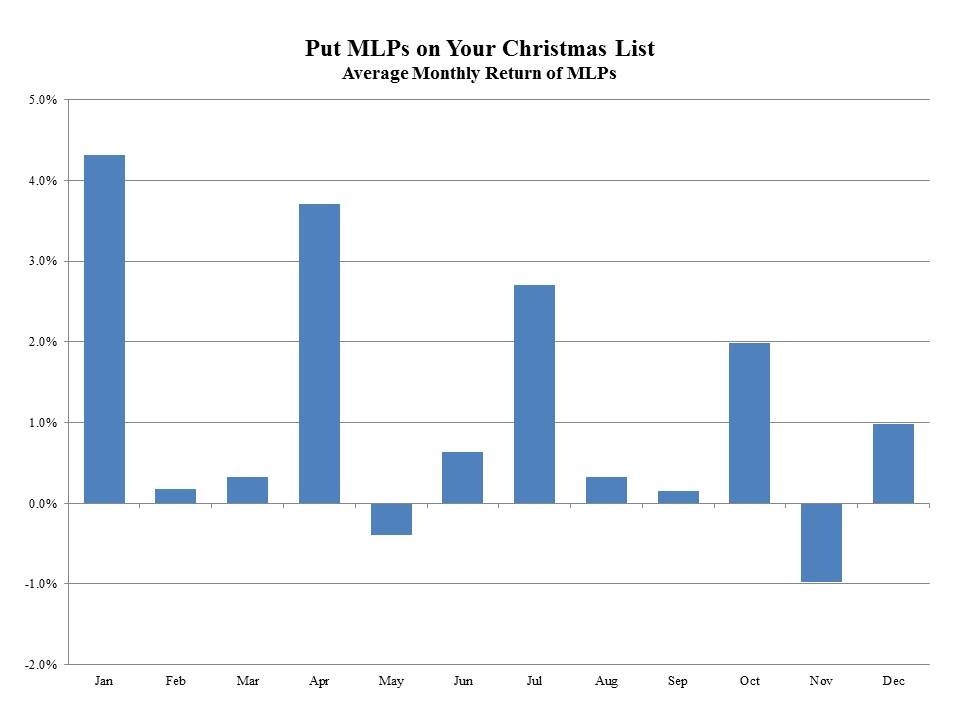
MLP Seasonals.

Of course, there’s always more detail to consider; November’s average return is the worst because it includes November 2008’s -17.1% drubbing. That month alone knocks the November average down by 0.27%. Then again, January’s average is helped by the January 2009 result of +15.25%, which adds 0.55% to January’s average. You can of course include and exclude months variously and get different results, the validity of which is to a person’s taste.

Nonetheless, the clear pattern is that MLP investors tend to buy (or sell less) in the first month of every quarter. This is probably because it coincides with quarterly distributions. The quarterly affect is magnified by the turning of the calendar.

Around this time of year, we advise MLP clients that if they’re contemplating making a commitment the seasonals suggest doing so in November, when prices are weak. If you’re a seller it makes sense to wait for January, since so few sellers seem to be available then.

The seasonals have not worked so well the last couple of years. Whether this is because they’re now so well known that they no longer work won’t be clear for a while longer. However, I’d bet that the universe of MLP sellers waiting until December or January to act is fairly small. If the recent price dislocations didn’t yet force you out, you’re probably in for the very long run. By contrast, the paucity of available sources of yield should draw reallocations towards a very cheap sector from investors digesting their Christmas dinner and pondering where their 2016 returns will come from.

Please remember that past performance is not indicative of future returns.

Bonds Are Dead Money

If you aspire to achieve acceptable returns from bond investments, the Fed is in no hurry to help you. They have other objectives than ensuring a preservation of purchasing power for buyers of taxable fixed income securities. Their failure to raise rates on Thursday is not that important — what’s more significant is the steadily ratcheting down of their own forecasts for the long term equilibrium Fed Funds rate.

For nearly four years the Fed has published rate forecasts from individual FOMC members (never explicitly identified) via their chart of “blue dots”. They now produce a table of values so there’s little ambiguity about its interpretation. Traders care mightily about whether they’ll hike now or in three months. It’s all CNBC can talk about. For investors, the Fed’s expectation for rates over the long run is far more interesting.

Since you might expect long run expectations about many things to shift quite slowly, by this standard the Fed’s long run forecast has plunged. The steady downward drift accelerated in recent meetings and it’s now fallen more than 0.5% since last year, to 3.35% (see chart). What this means is that their definition of the “neutral” fed Funds rate (i.e. that which is neither stimulative nor constraining to economic output) is lower. They don’t have to raise rates quite as far to get back to neutral.

Their inflation target remains at 2%, although inflation, at least as measured, is clearly not today’s problem. So the real rate (i.e. the difference between the nominal rate and inflation) has now come down to less than 1.5%. Since bond yields are in theory a reflection of the average short term rate that will prevail over the life of a bond, the Fed believes investors in investment grade debt with negligible default risk should expect this kind of real return. For a taxable investor, this will result in more or less a zero real return after taxes.

FOMC Rate Forecast Sept 2015The Fed’s communication strategy has  not been that helpful over the short run. Although we are provided with far more information about their thinking, it simply reveals that they don’t know much more than private sector economists and like them are always waiting for more information. The FOMC doesn’t want to provide firm guidance, since that requires a commitment which results in lost flexibility (see Advice for the Fed). The evenly split expectations for last Thursday show that forward guidance hasn’t helped traders much. But that doesn’t matter for investors; the insight into their long term thinking, presented as it is in a quantitative form, really is useful.

Hawkish is not an adjective that will be applied to this Fed anytime soon. In fact, one FOMC member included a forecast for a negative Fed Funds rate by year-end, a no doubt aspirational forecast but probably the first time an FOMC member has advocated such a thing. The Fed chair is clearly among ideological friends. Janet Yellen’s deeply held feelings for the unemployed inform her past writings and those of her husband George Akerlof. These are admirable personal qualities and not bad public policy concerns. Given that inflation remains below the Fed’s target, monetary policy can remain focused on doing all it can to promote growth, thus raising both employment AND inflation. Wgat some perceive as the Fed’s short run trade-off between maximizing employment and controlling inflation is unlikely to be tested anytime soon. Rates will rise slowly, because the future is always uncertain and because the neutral policy rate is in any case steadily falling towards the current one.

The low real rate contemplated by the Fed reflects their lower estimate of the economy’s growth potential. This is not a contentious view, it’s just that we’re seeing it play out through their rate forecasts.

The clear implication for bond investors though is that it’ll be a very long time before they make any money. The Barclays AGG is +0.64% YTD. This is the type of return bond investors can expect. Taxable investors are losing money in real terms and the Fed hasn’t even begun raising rates yet. Moreover, it’ll be years before this Fed gets bond yields to levels where a decent return is possible. It’s as I said two years ago in Bonds Are Not Forever; The Crisis Facing Fixed Income Investors. Bond holders are in for years of mediocre results or worse. It’s not going to be worth the effort. Take your money elsewhere.


Rate Hike Or Not, The Same Problems Persist

On May 22, 2013 then-Fed chairman Ben Bernanke inadvertently added “taper tantrum” to the lexicon of terms used to describe the impact of the Fed’s activities. That date marks the formal beginning of the Fed’s efforts to prepare financial markets for an eventual tightening of policy — or the start of the removal of accommodative policy, to use their description. In the belief that transparent policy deliberations reduce the possibility of a monetary surprise with its consequent financial market upheaval, the Fed’s public statements, release of projections and even the ubiquitous “blue dots” showing the rate forecast of each FOMC member have all been provided to help us. In fact, for almost four years I’ve been constructing an “FOMC Futures Curve”, which is what short term interest rate futures would look like if FOMC members were the only participants. It’s been absorbing for brief moments around four times a year when they provide updated information. Many might find it a nerdy preoccupation, but having spent a good part of my career in Fed-engineered darkness over their intentions, the shift to greater openness begun under Greenspan has been fascinating.

Forward guidance presumably is intended to let us know what the Fed will do before they do it. As we head into a two-day FOMC meeting on September 16-17, opinions are evenly split about whether they’ll raise rates. Perhaps we ought not to be surprised in either outcome, but it seems to me that if there’s no consensus after years of openness, the communication strategy has failed. The problem with providing meaningful forward guidance is that it involves a commitment, and a commitment reduces your ability to change your mind. The window into the Fed’s deliberations has simply revealed that they want to retain maximum flexibility until the day they meet. Announcing a hike with a delayed effective date would soften the blow (see Advice for the Fed) but it’s too late for that.

Following the FOMC’s announcement and the elimination of near term uncertainty, investors will be faced with the same dilemma as before: how are they to invest so as to preserve the purchasing power of their assets after taxes and inflation? Whether ten year treasury yields move up 0.25% or not this week, the paucity of assets offering acceptable returns will remain Dilemma #1.

Suppose a taxable investor visits her financial advisor with the objective of constructing a portfolio with a 6% return and moderate risk. Assuming our investor is facing a 30% average tax rate (combination of Federal and state taxes on capital gains, dividends and ordinary income), a pre-tax 6% is 4.2% afterwards. 2% inflation (the Fed’s target) knocks that return down to 2.2%. Then there are the advisor’s fees, and the possibility that returns won’t be as hoped. 6% doesn’t seem that demanding given all of this, and yet the building blocks with which to achieve it are limited.

Public equities yield around 2%, and assuming the fifty-year average dividend growth rate of 5% prevails (for a total return of 7%), stocks clearly are part of the portfolio. Bonds (as defined by the iShares Aggregate Bond ETF which tracks the Barclays Aggregate Index) yield 2.4%. Since the yield at which you buy a bond heavily impacts your total return, it’s going to be hard to do much better than 2.4% with investment grade debt. Moreover, the ability of bonds to offset a falling equity market is limited given their already low yields. Backward-looking models may justify them, but to us they look like returnless risk. Moving up the risk spectrum to High Yield gets you 5.5% (as defined by the iShares High Yield Corporate Bond ETF). There is some chance for capital appreciation — but this year capital losses have more than wiped out coupon income reflecting the preponderance of energy names in the index.

REITs yield 4.4% (as defined by the Vanguard REIT ETF), and this, combined with some modest growth may deliver a return that at least equals the investor’s 6% target.

Regular readers can by now guess where this is going. The Alerian MLP Index, yields 7.25%, and MLP distributions even grew in 2009 following the financial crisis. However, MLPs are down 23% so far in 2015. In fact, they’ve fallen that much since the end of April, creating an unpleasant backdrop to an otherwise glorious Summer for anyone more than tangentially involved.

There is a bear story to MLPs, as those prescient enough to sell at the highs of August 2014 well know. A 33% drop can’t happen without a fundamental story, and the collapse in oil is challenging the expected production growth of U.S. shale plays with its attendant reduction in needed infrastructure. The growth story that has driven MLP prices is in doubt.

It’s therefore instructive to examine metrics on a number of businesses as they were in August 2014 and how they appear today. The table below shows forecasts for 2016 distributions from selected MLPs (chosen unscientifically because we are invested in them or the General Partners that control them), and shows how those 2016 forecast distributions have changed from the market peak in MLPs 13 months ago to now. The data is from JPMorgan but such figures are typically heavily influenced by company guidance.

Looking at the numbers, you certainly wouldn’t think we’d seen a collapse in oil. The 2016 forecast distribution for this group is modestly lower at $2.90 (cap-weighted) versus $2.99 a year ago. The market cap of these companies (excluding Kinder Morgan since during the intervening period it combined with its two outstanding MLPs to create a substantially larger entity) has fallen by 16%, hence the 2016 yield has risen from 5.2% to 6.8%. Just looking at the General Partners in this group (KMI, OKE, PAGP and WMB) provides a similar result. The operations of these firms and their cashflow generating abilities have on average not shifted that much. Plains All America (PAA) and its GP (PAGP) have seen forecast reductions because of their crude oil exposure. The same is true of Oneok (OKE).

But overall, the fall in their security prices has simply driven up their yields. These names are representative — they’re all midstream, which is to say they operate toll-like business midels with limited direct commodity exposure. There are MLPs concentrated in Exploration & Production (upstream) and others that run refineries (variable distribution MLPs), but we don’t care about those.

So for the investor seeking a 6% portfolio return, the most compelling reason to exclude MLPs is the 23% drop since April which has made few people happy. However, looking beyond the undoubted voting by many investors who have abandoned the sector, 7% yields combined with 8-9% growth rates (the cap-weighted forecast on the group of names listed) seems pretty compelling for long-term investors willing to look beyond recent price action and focus on the fundamentals by including MLPs, perhaps even with an overweight, in their portfolios.

MLP Distribution Forecasts September 11 2015 V2

Why You Might Care About Risk Parity Strategies

Everybody wants to know why the market just did what it did, and what is its next likely move. Chinese equities don’t seem that important to us, but the U.S. sell-off in August coincided with the Chinese one so maybe there’s a stronger connection than we thought. It’s important because investors would love to alter their risk profile profitably — taking more risk when markets are rising and less risk when they’re falling. There is of course an easy way to do this, which is through buying call options. Through their command of Greek, an option’s Delta (your exposure) moves in synchronicity with the market in a thoroughly satisfying way (if you’re long), and the more Gamma you have the more co-operatively your Delta recalibrates your risk appropriately. The snag with this most Utopian of investment postures is that buying options costs money. The happy state in which options deposit their holders cannot be had for free.

Nonetheless, the search for free, optimized risk is never-ending. Investors want more risk when it’s low and less when it’s high.  Put another way, they want less risk but not yet, as St. Augustine (“Give me chastity…but not yet”) might say if he was alive today and glued to CNBC. Older readers will recall Portfolio Insurance, which was blamed for the 1987 crash. Its adherents were required to sell when prices were falling and buy when they’re rising, mimicking the exposure shifts created by being long options but without having to fork over the option premium. It must have worked for a while, but most good ideas in investing eventually die of popularity, and too many portfolio insurers ultimately ran out of less-informed market participants against whom to trade. For the iron rule of hedging is that it requires the availability of a counterparty who isn’t hedging.

Today’s Risk Parity (RP) strategies are more sophisticated, as you might expect given the quantum increase in desktop computing power over the last 28 years. Practitioners target a specified amount of risk (typically defined as volatility) for each chosen asset class, and vary the amount of assets invested as needed. Higher expected volatility tomorrow, which is usually the result of higher actual market volatility today, requires reduced holdings in that asset class so as to maintain constant risk exposure. At its most basic, RP reduces down to changing your risk profile as your forecast of market volatility changes. Equity markets rise slowly and fall sharply, so looking back at a rising market makes you want more of it, and less of one that’s falling. These are pro-cyclical strategies, and they’ve evidently been very successful because their followers are growing in number. RP and other momentum strategies are now blamed by some for the performance of stocks in August. Leon Cooperman of Omega Advisors, a big hedge fund, blamed risk parity strategies for both his fund’s and the S&P500’s poor results. How ironic that one overcapitalized sector (hedge funds) is complaining about another over-capitalized one (RP). For more on hedge funds, see Direct or Indirect, the hedge fund industry can’t deliver.

Before you discount Leon Cooperman as offering a self-serving defense, you should know that JPMorgan’s Marko Kolanovic published a recent research note in which he sought to quantify the volume of selling that such strategies might execute in different market scenarios. By calculating the amount of RP and momentum-based capital and adding informed judgments on how it reacts, he came up with numbers, and he concluded that selling in the hundreds of billion of dollars is possible. Moreover, because such portfolio adjustments take place over many different time periods, the type of dislocation that we saw on, say, Monday August 24th will, in his opinion, be repeated.

Much of this risk on/risk off activity measures risk as volatility, which is not the best measure for most investors unless you use leverage. Investing with borrowed money means you not only care about whether an investment travels from 10 to 20, but also the path it takes on its way there. Stopping at 5 first represents merely an inconvenient detour for the cash investor but a potentially capital-destroying one for the leveraged one as a margin call forces untimely liquidation. Cash investors who worry excessively about the market are emotionally leveraged if not economically so; their best move is to reduce their positions to the point at which they are more concerned with their golf swing. For a cash investor, the risk of a permanent loss is the risk they care about. If you own companies with strong balance sheets and earnings power, the path prices follow needn’t concern you. Just focus on the health of your companies’ businesses.

The nice thing about Leon Cooperman’s complaints is that our inability to link Chinese equity volatility with the U.S. looks slightly more forgivable. In fact, it renders most short term market judgments invalid unless they accommodate the emotionless algorithmic activity of RP. Explaining market moves in the context of fundamental developments may be less important than interpreting them through the eyes of systemic traders. This is our Brave New World. Investors should conduct their affairs accordingly.

image_pdfimage_print